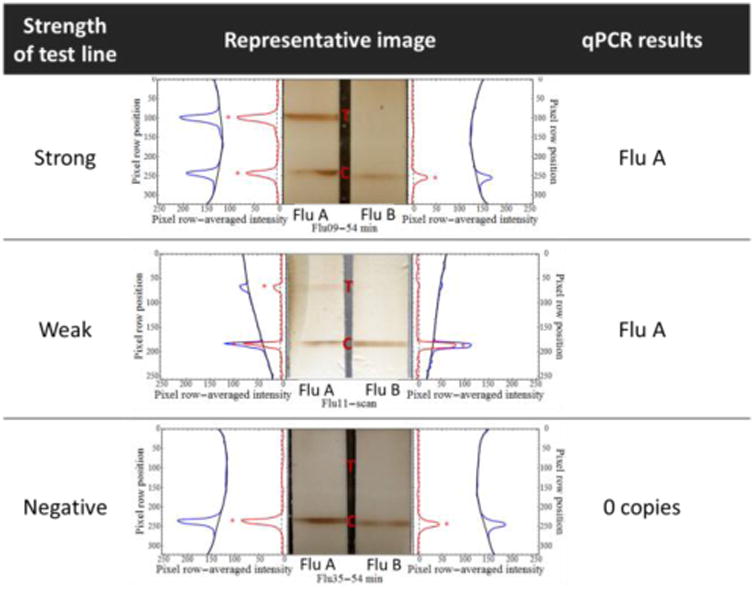
Figure 5.

Examples of the extracted signal profiles for strong, weak, and negative results. The row-averaged pixel intensities in the blue channel of test strip images were used to generate plot profiles for each test strip (blue lines). Sixth-order polynomials (black lines) were fit to the background regions of each plot profile. Test lines were detected as thresholded (dotted black lines) excursions (red asterisks) of the background-subtracted plot profiles (red lines) beyond three standard deviations of the mean background-subtracted intensity (dotted black lines).
