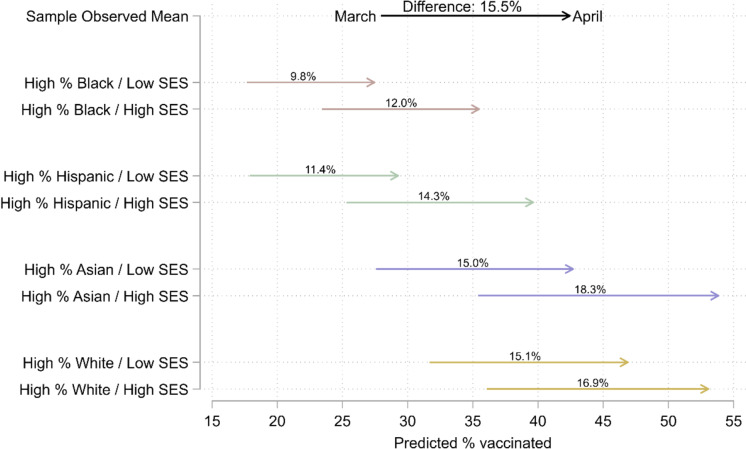
Fig. 2.
Simulated COVID-19 vaccination levels by racial/ethnic and socioeconomic composition in the population age 15 and older of ZIP Codes across eight large US cities, March and April 2021. Note: This figure illustrates simulated sample-wide means assuming each ZIP Code had a given socioeconomic and racial/ethnic composition. We defined low and high levels as below the 10th and above the 90th within-city percentiles, respectively. We defined SES levels by setting all four socioeconomic variables to the same within-city percentiles within each scenario. We set other independent variables to within-city averages in each scenario. We include the true (observed) sample-wide average values of the dependent variable on the top row for comparison. The “% vaccinated” is the percent of the population age 15 and older with at least one dose of a COVID-19 vaccine

