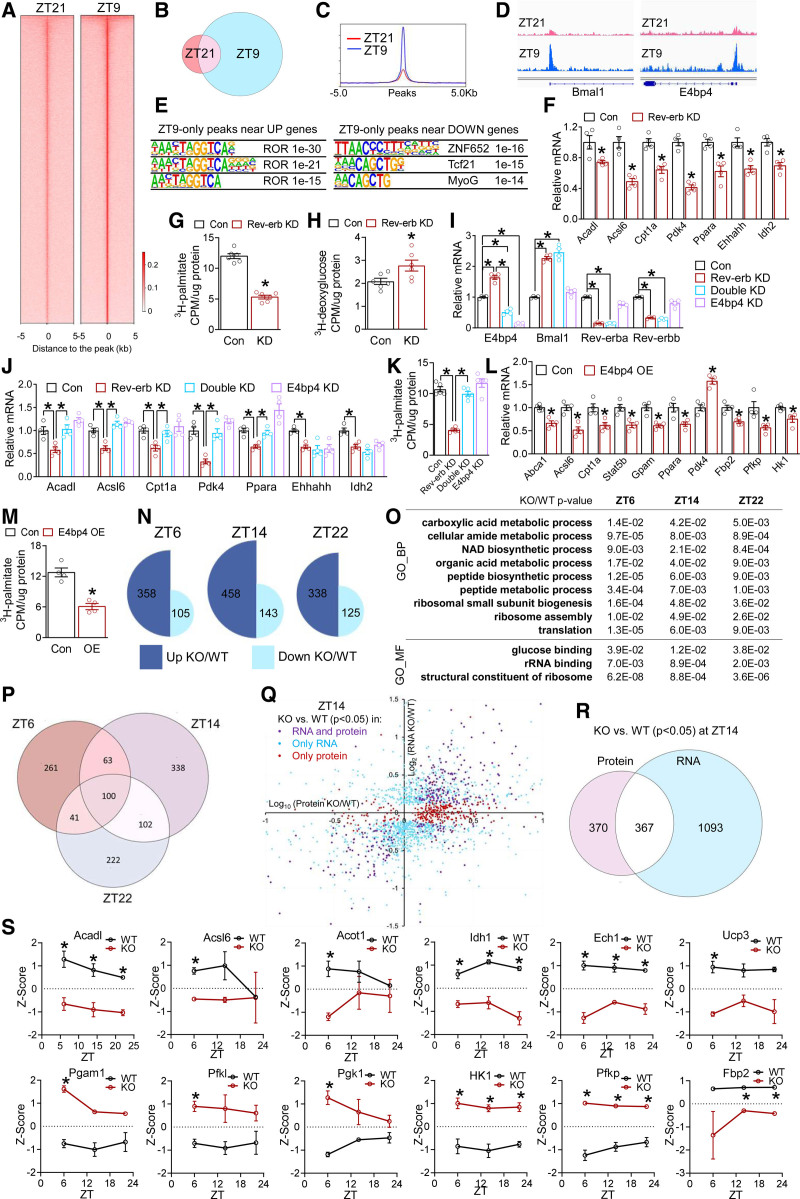
Figure 3.
Rev-erb uses multiple modes to regulate cardiac transcriptome and proteome. A, Heat map of Rev-erbα chromatin immunoprecipitation sequencing signals in isolated cardiomyocyte nuclei at all peaks. B, Overlap of Rev-erbα binding peaks at ZT9 and ZT21. C, The average profile of Rev-erbα binding peaks at ZT21 and ZT9. D, Browser tracks of Rev-erbα peaks at Bmal1 and E4bp4. E, Top enriched motif and P values in high-stringency Rev-erbα peaks within 10 kb of the transcription start sites of differentially expressed genes that were upregulated (UP) or downregulated (DOWN) in KO vs WT hearts, respectively. F, RT-qPCR analysis in AC16 cells transfected with small interfering RNA to knockdown Rev-erbα/β (Rev-erb KD) or small interfering RNA control (Con). Each dot represents an independent well of cells (F–M). *P<0.05 between 2 groups by 2-sided t test for F through M. G, Fatty acid oxidation (FAO) rate in AC16 cells after knockdown of Rev-erb (KD, or Rev-erb KD), n=6 wells. H, Glucose uptake assay in AC16 cells after knockdown of Rev-erb (KD, or Rev-erb KD), n=6 wells. I and J, RT-qPCR analysis in AC16 cells after knockdown of Rev-erb (Rev-erb KD) or E4bp4 (E4bp4 KD) or both (Double KD), n=4 wells. K, FAO rate in AC16 cells, n=5 wells. L, RT-qPCR analysis in AC16 cells overexpressing E4bp4 (E4bp4 OE) or green fluorescent protein as a control (Con), n=4 wells. M, FAO rate in AC16 cells overexpressing E4bp4 (OE), n=4 wells. N, Differentially expressed proteins (DEPs) between KO and WT at the indicated ZTs (|Log2FC| >0.58 and P<0.05 by t test). O, Shared Gene Ontology terms of DEPs between KO and WT at all ZTs, as analyzed by iPathwayGuide. P, Overlap of DEPs in KO vs WT at the indicated ZTs. DEPs cutoff: |Log2FC| >0.58 and P<0.05 by t test. Q and R, Correlation and overlap of the differentially expressed genes and DEPs (KO vs WT) at ZT14 using P<0.05 as the cutoff for both RNA and protein. S, Relative protein levels based on the average and standard deviation of all samples at all time points, n=3 mice. *adjusted P<0.05 by 2-way ANOVA with Bonferroni multiple comparisons test. Data are represented as mean±SEM. *P<0.05 between groups by 2-sided t test, unless otherwise stated. See Table S6 for statistical details. BP indicates biological process; KD, knockdown; KO, knockout; MF, molecular function; ROR, retinoid-related orphan receptor; RT-qPCR, quantitative reverse transcription polymerase chain reaction; WT, wild type; and ZT, Zeitgeber time.

