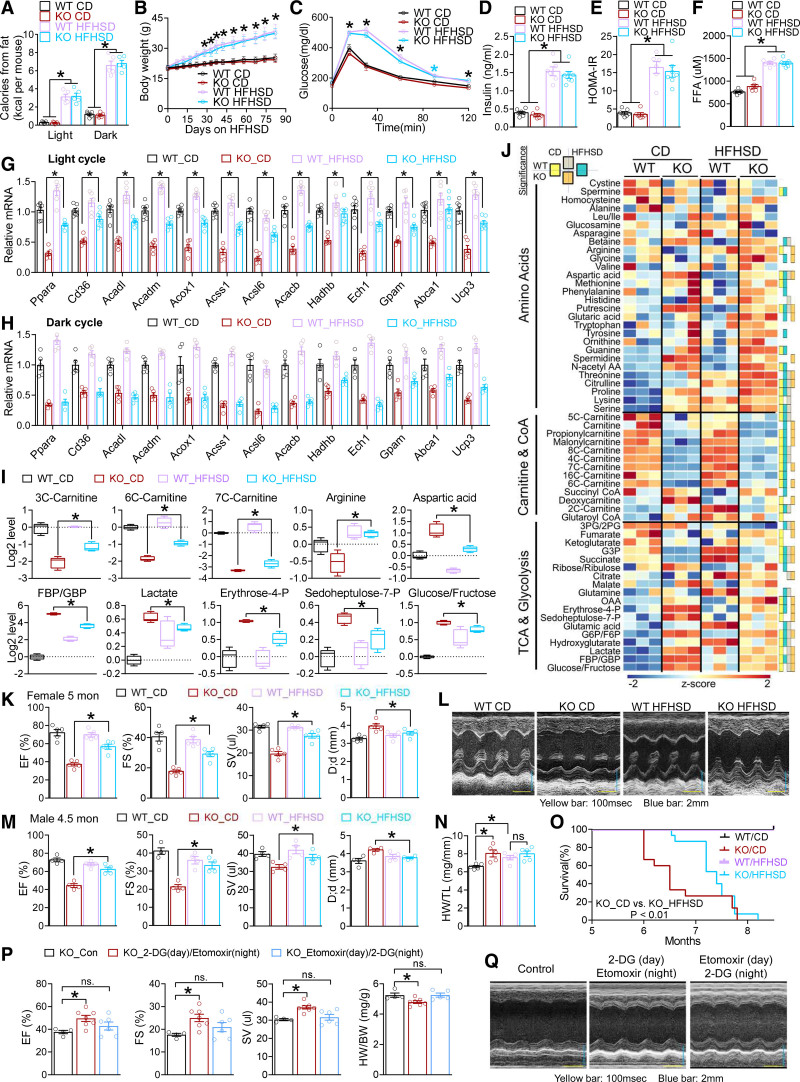
Figure 6.
HFHSD rescues cardiac dysfunctions in Rev-CKO mice. A, Calorie intake from dietary lipids during light and dark cycles in female mice fed with CD or high-fat high-sucrose diet (HFHSD), n=5 mice. B, Body weight of female mice. HFHSD started at 8 weeks of age, n≥5 mice. C, Glucose tolerance test (GTT) at 5 months of age, n=8 mice for WT_CD, n= mice for KO_CD and WT_HFHSD, n=8 for KO_HFHSD. *(blue) P<0.05 between CD and HFHSD in KO mice. D and E, Basal insulin levels and the relative Homeostatic Model Assessment for Insulin Resistance (HOMA-IR) in female mice at 5 months of age, n≥6 mice. F, Blood free fatty acid (FFA) levels in female mice at 5 months of age in the light cycle, n ≥ 6 mice. *P<0.05 between CD and HFHSD by 2-sided t test for both genotypes for A through F. G and H, quantitative reverse transcription polymerase chain reaction analysis of the hearts harvested at ZT6–9 (light cycle) or ZT18–21 (dark cycle) from WT and KO female mice on HFHSD at 5 months of age, n≥6 mice. HFHSD started at 8 weeks of age. I and J, Metabolomics analysis in the cardiac ventricles of WT and KO male mice at 4.5 months of age, n=3 mice. Mice were harvested at ZT6. HFHSD started at 8 weeks of age. Color boxes on the right represent significant differences (adjusted P values for t test at a false discovery rate [Benjamini Hochberg method] threshold of <0.25) for any 2-group comparisons as indicated. Box plots center lines, limits, and whiskers represent the median, quartile, and minimum/maximum values, respectively. *Adjusted P values for t test at an false discovery rate (Benjamini Hochberg method) threshold of <0.25 between 2 indicated groups. K and L, Echocardiography analysis (n=5 mice) and representative M mode images in female mice at 5 months of age. HFHSD started at 8 weeks of age. M, Echocardiography analysis of male mice at 4.5 months of age on HFHSD, n=4 mice. HFHSD started at 8 weeks of age. N, Heart weight (HW) to tibia length (TL) ratio in male mice at 5 months of age, n=5 mice. O, Survival curve, female mice, n=15, analyzed with Kolmogorov-Smirnov test. P and Q, Echocardiography analysis (n=4 mice for KO_Con, n=7 mice for KO_2-DG (day)/etomoxir (night), n= 6 mice for KO_Etomoxir (day)/2-DG (night), the HW/TL ratio, and representative M mode images of male KO mice at 5 months of age after chronic treatment of 2-DG and etomoxir at the indicated time of the day. The sample size is indicated in the figure unless otherwise stated. Each dot represents an individual mouse. Data are mean±SEM. *P<0.05 between groups by 2-sided t test. See Table S6 for statistical details. BW indicates body weight; CD, chow diet; CoA, coenzyme A; D;d, left ventricular dimension at end-diastole; 2-DG, 2-deoxyglucose; EF, ejection fraction; F6P, fructose 6-phosphate; FBP, d-fructose 1,6-bisphosphate; FS, fractional shortening; GBP, d-glucitol 1,6-bisphosphate; G3P, glyceraldehyde 3-phosphate; G6P, glucose 6-phosphate; KO, knockout; OAA, oxaloacetate; 2PG, 2-phosphoglyceric acid; 3PG, 3-phosphoglyceric acid; SV, stroke volume; TCA, tricarboxylic acid cycle; and WT, wild type.

