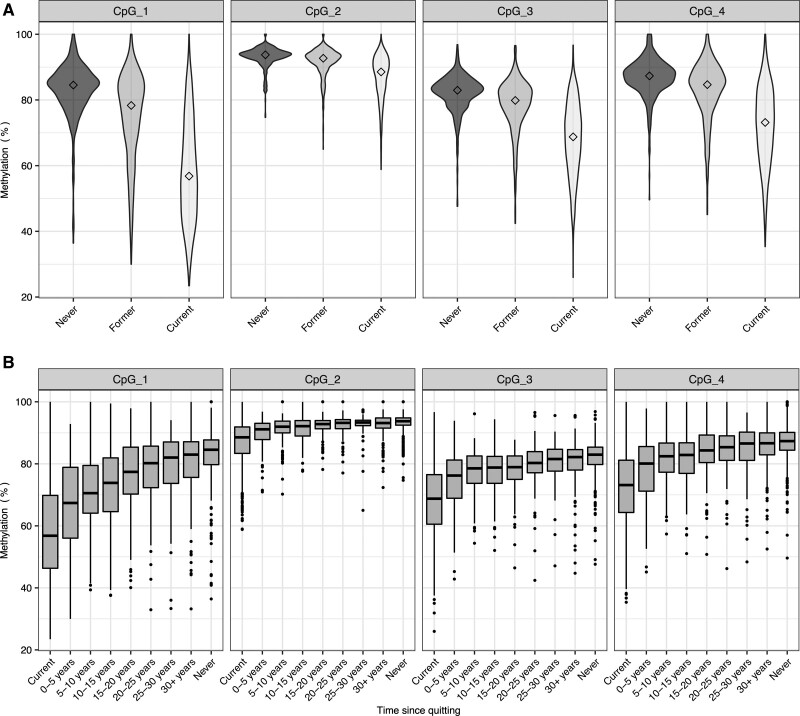
Figure 2.
DNA methylation extent (%) at F2RL3 by smoking status in selected participants from the Copenhagen City Heart Study (N=3205). A, Violin plot of DNA methylation extent (%) at each cytosine–phosphate–guanine (CpG) of F2RL3 according to smoking status at the time of sampling. Median values are marked by diamonds. N for each group is as follows: never=548; former=1068; current=1589. Results from a linear regression of DNA methylation on smoking group, adjusted for age and sex, are given in Table S2A; in all cases, P<6.0×10−05. B, Boxplot of DNA methylation extent (%) at each CpG of F2RL3 by time since quitting smoking in former smokers. DNA methylation extent is also presented for current smokers and never smokers. N for each group is as follows: Current: 1589, 0–5 y: 135, 5–10 y: 127, 10–15 y: 127: 15–20 y: 109, 20–25 y: 99, 25–30 y: 71, 30+ years: 203, never: 548. Upper and lower hinges of boxplots correspond to the first and third quartiles with the centre line indicating the median and whiskers extending from the hinge to the largest (smallest) value no further than 1.5×interquartile range from the hinge. In a linear regression model fitted on data restricted to former smokers, the estimated change in F2RL3 DNA methylation per additional year since smoking cessation (adjusting for age and sex) was 0.42 (95% CI, 0.35–0.48), 0.08 (95% CI, 0.06–0.10), 0.18 (95% CI, 0.14–0.22), and 0.23 (95% CI, 0.19–0.27), for CpG sites 1 to 4, respectively (Table S2B).

