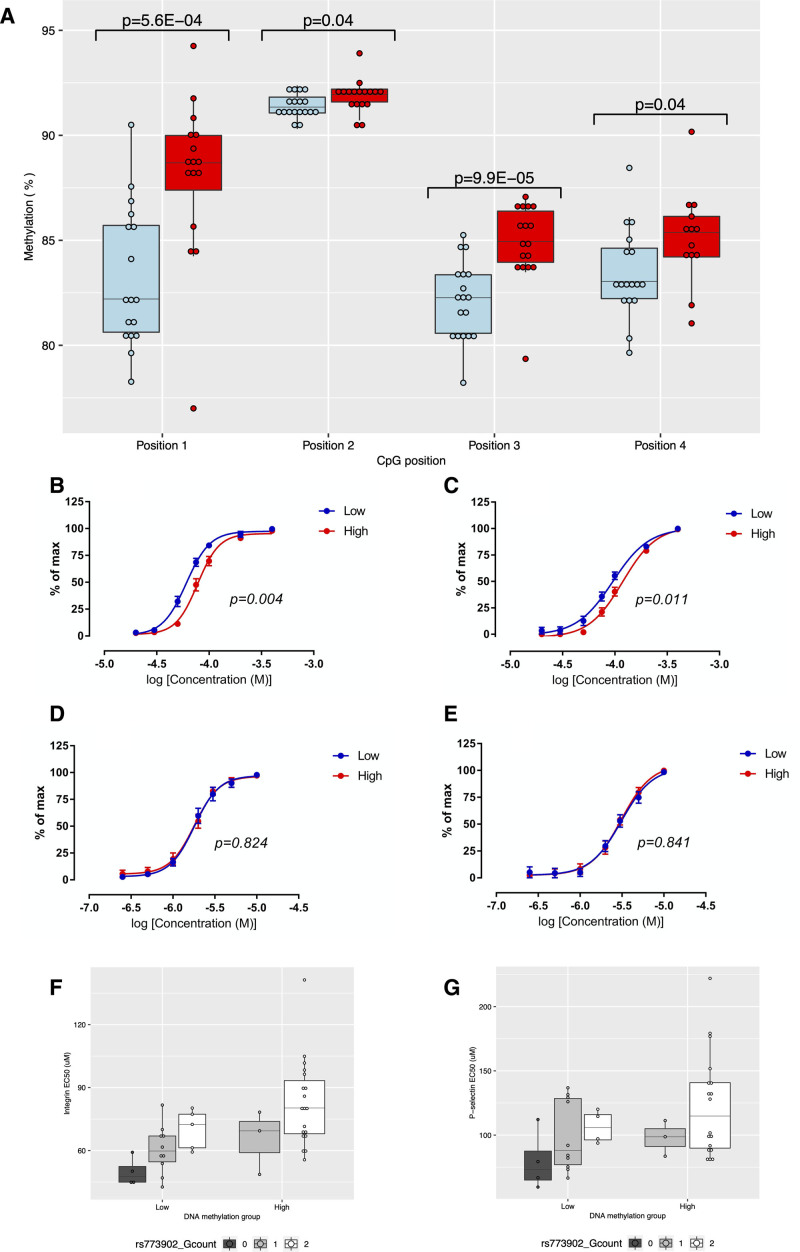
Figure 3.
Differential platelet reactivity between groups of Avon Longitudinal Study of Parents and Children (ALSPAC) participants selected based on low (blue, n=19) or high (red, n=22) DNA methylation during childhood and adolescence. A, Boxplot showing the between group difference in DNA methylation extent (%) at the time of platelet reactivity assessment at 4 cytosine–phosphate–guanine (CpG) positions in F2RL3 as assessed by 2-sample 2-sided t test (assuming equal variances). B and C, Levels of αIIbβ3 integrin (B) and α-granule P-selectin exposure (C) following platelet stimulation with the PAR4 (protease-activated receptor 4)-specific agonist peptide, AYPGKF. P values derived from a by-group comparison of dose response curves performed by 2-way ANOVA. Points represent group means with 95% CIs; (D and E) Levels of αIIbβ3 integrin (D) and α-granule P-selectin exposure (E) following platelet stimulation with the PAR1-specific agonist peptide, SFLLRN. P values derived from a by-group comparison of dose response curves performed by 2-way ANOVA. Points represent group means with 95% CIs; (F and G) Boxplot showing the between group difference in αIIbβ3 integrin EC50 (F) and α-granule P-selectin EC50 (G) in response to PAR4-specific agonist peptide AYPGKF, by rs773902 genotype. In boxplots, upper and lower hinges of boxplots correspond to the first and third quartiles with the centre line indicating the median and whiskers extending from the hinge to the largest (smallest) value no further than 1.5×interquartile range from the hinge.

