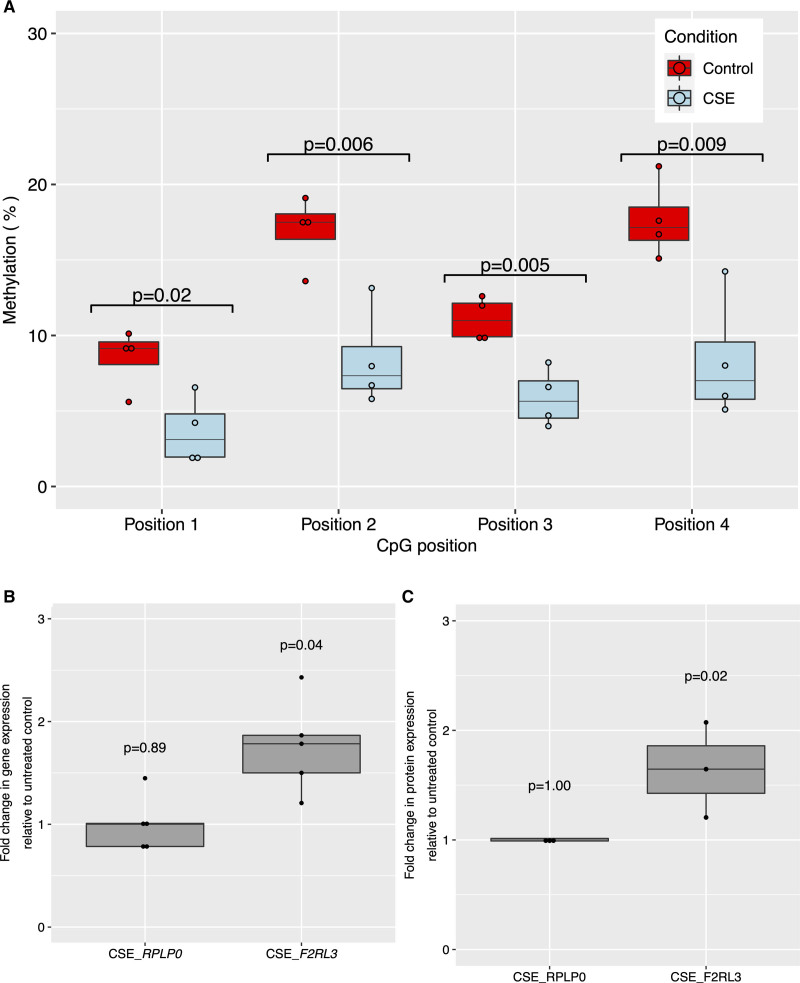
Figure 4.
Effect of cigarette smoke exposure (CSE) on F2RL3 DNA methylation, mRNA expression and protein abundance in acute megakaryocytic leukemia (CMK) cells. A, Boxplot showing between treatment difference in methylation %. Control=no treatment (n=4); CSE=exposure of cells to cigarette smoke extract (n=4). Test results are for a 2-sample 2-sided t test for a difference of means. B, Boxplot showing effect on gene expression of exposure of CMKs to 96 h of CSE compared with untreated control cells for F2RL3 (n=5) and the endogenous control RPLP0 (n=5). Test results are for a 2-sample 2-sided t test for a difference of means between CSE treated cells and untreated controls in each case. C, Boxplot showing effect on protein expression of exposure of CMKs to 96 h of CSE (n=3) compared with untreated control cells (n=3) for F2RL3/PAR4 and the endogenous control RPLP0. Test results are for a 2-sample 2-sided t test for a difference of means between CSE treated cells and untreated controls in each case. In boxplots, upper and lower hinges correspond to the first and third quartiles with the centre line indicating the median and whiskers extending from the hinge to the largest (smallest) value no further than 1.5×interquartile range from the hinge. Source data are provided as a Source Data file (see Data Access Statement).

