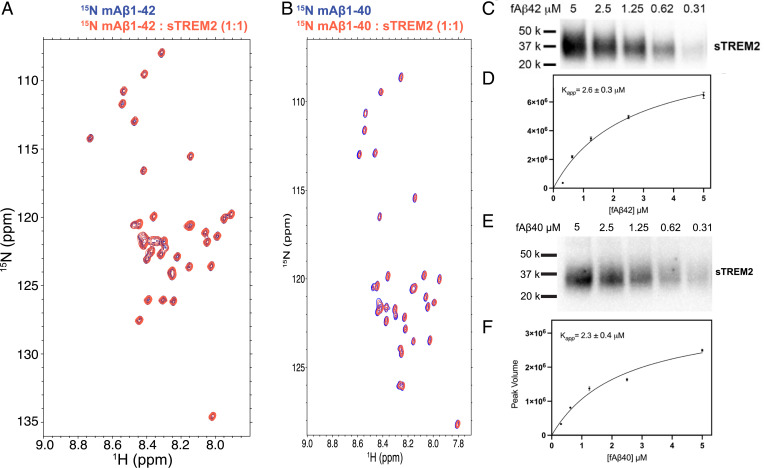
Fig. 2.
(A) 15N HSQC spectra of 100 μM 15N mAβ42 alone (blue) and with 100 μM sTREM2 (red). (B) 15N HSQC spectra of 100 μM 15N mAβ40 alone (blue) and with 100 μM sTREM2 (red). (C) A cosedimentation assay to quantify sTREM2/fibrillar Aβ42 binding by incubating sTREM2 (10 nM) with various concentrations of fibrillar Aβ42. Quantification of fibril-bound sTREM2 using Western blot probed by anti–His-HRP conjugate antibody. (D) A binding curve obtained by fitting the data to a saturation binding model. The apparent binding constant is 2.6 ± 0.3 μM. (E) A cosedimentation assay to quantify sTREM2 and fibrillar Aβ40 binding by incubating 10 nM sTREM2 with various concentrations of fibrillar Aβ40. The Western blot was stained using anti–His-HRP conjugate antibody. (F) A binding curve obtained by fitting the data to a saturation binding model. The apparent binding constant for sTREM2 to Aβ40 is 2.3 ± 0.4 μM.

