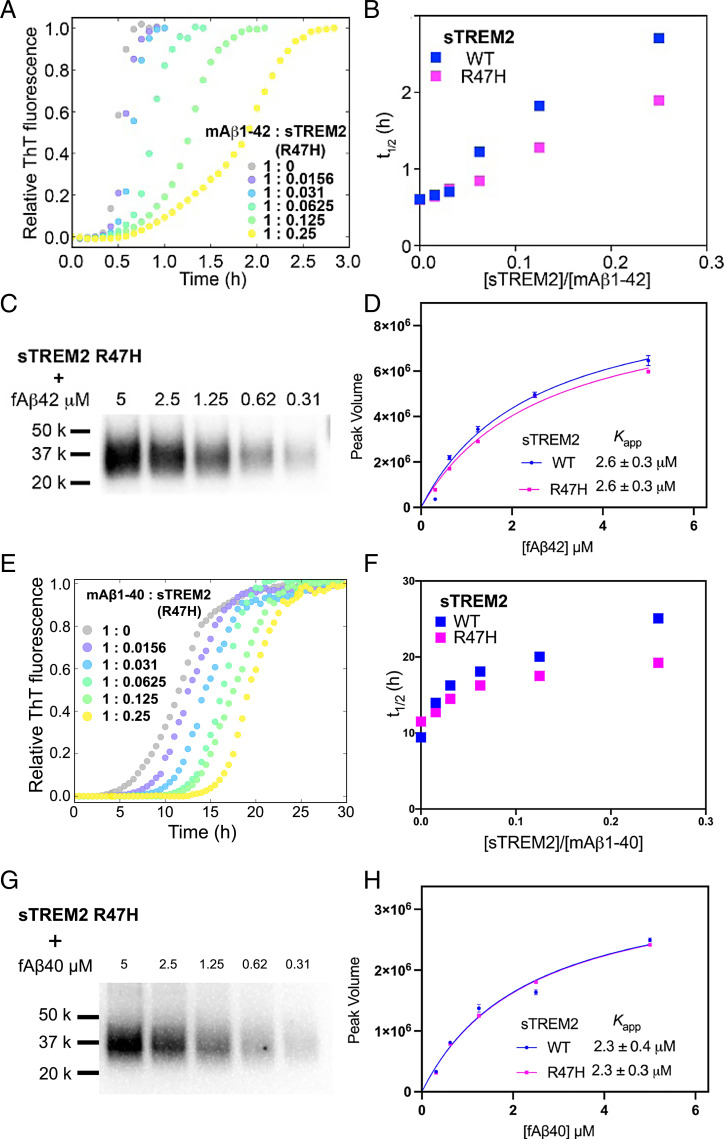
Fig. 3.
(A) The aggregation traces (dotted line) of 4.9 µM monomeric Aβ42 monitored by ThT fluorescence in the absence and presence of sTREM2 R47H. (B) The half-time (t1/2) derived from Aβ42 aggregation traces with sTREM2 WT or R47H. R47H displayed reduced inhibition. (C) Binding of fibrillar Aβ42 to sTREM2 R47H. (D) Binding curves of fibrillar Aβ42 to sTREM2 WT and R47H. Both WT and R47H showed similar binding affinity. (E) The aggregation traces (dotted line) of 5 µM monomeric Aβ40 monitored by ThT fluorescence in the absence and presence of sTREM2 R47H. (F) The half-time (t1/2) derived from Aβ40 aggregation traces with sTREM2 WT or R47H. R47H displayed reduced inhibition. (G) Binding of fibrillar Aβ40 to sTREM2 R47H. (H) Binding curves of fibrillar Aβ40 to sTREM2 WT and R47H. Both WT and R47H showed similar binding affinity. Replicates of aggregation kinetics for determination of t1/2 for sTREM2 WT and R47H are listed in SI Appendix, Table S1.

