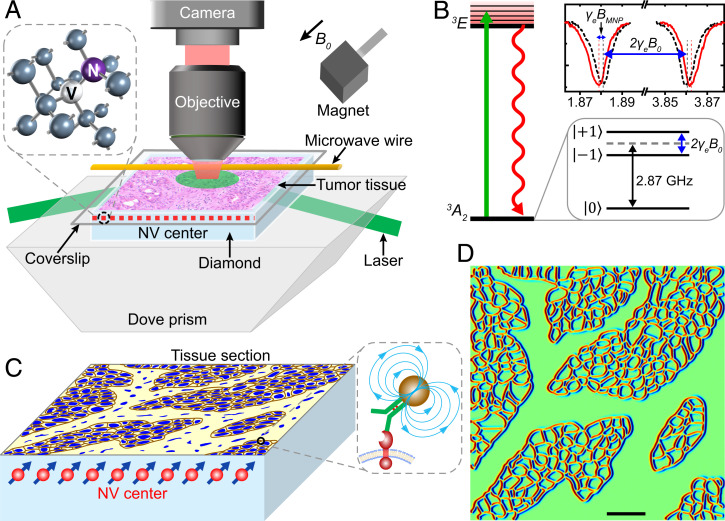
Fig. 1.
Schematic of diamond magnetic microscope and principle of tissue magnetic imaging. (A) Diamond magnetic microscope. The homebuilt wide-field ODMR setup is combined with a commercial optical microscope to achieve both optical and magnetic imaging of tumor tissues. An assumptive tumor tissue on the glass coverslip is located on the diamond surface. The green laser beam (532 nm) illuminates the NV centers layer, and the fluorescence is collected through an objective to an sCMOS camera. A permanent magnet creates a magnetic field B0, and the microwave is delivered by a copper wire. Inset shows the structure of an NV center. The NV centers along the B0 are used to sense the magnetic signal in the tissue. (B) Energy-level diagram of the NV center. Zero-field splitting degenerates the and with 2.87 GHz. Under magnetic-field B0 (here, 354 gauss), the energy level of splits due to the Zeeman effect, which is proportional to B0 (Δ = 2γeB0, for NV gyromagnetic ratio γe = 2.80 MHz/gauss). The peak appears in the CW spectrum when the microwave frequency is resonant with the allowed transition → or → The local magnetic field of MNP shifts the peak positions by a magnitude of γeBMNP. (C) A tissue section is detected by the NV centers. A 100-nm-thick layer of dense NVs is used to image an MNP-labeled tissue section. The distribution of target proteins in the tissue is deduced from the frequency shift caused by MNPs. Brown lines represent MNP-labeled membrane proteins, and blue structures represent cell nuclei. (D) Simulated magnetic image of the tissue in C. We assume that MNP-labeled proteins uniformly distribute on the cell membrane. The protein map is then illustrated here, and the red and blue lines mark the magnetic signal as two poles. (Scale bar, 50 μm.)

