Fig. 5.
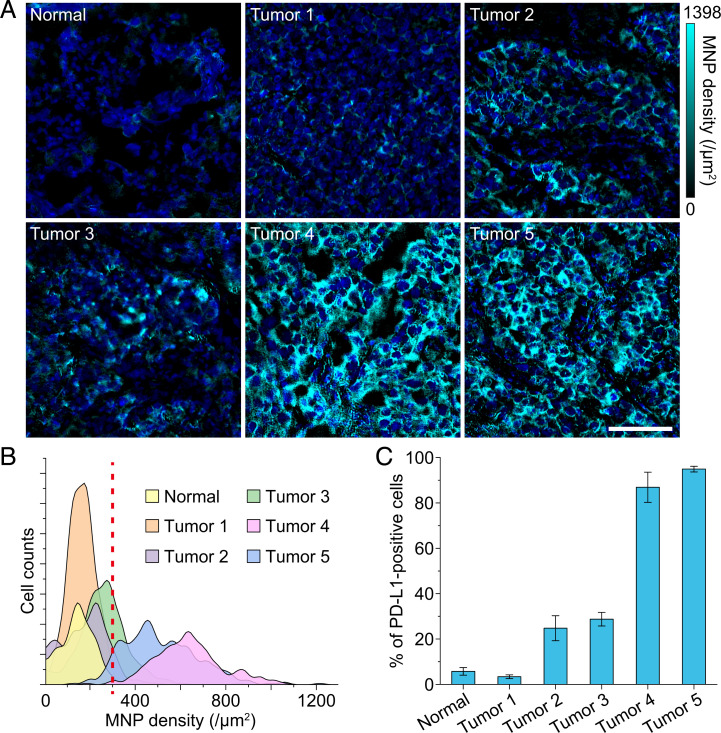
Magnetic quantification of PD-L1 in lung tissues. (A) Reconstructed IMM images of PD-L1 in a normal lung tissue and five lung tumor tissues. We adjusted color bars to the same dynamic range to intuitively show the difference of PD-L1 expression levels among different samples. Shown are DAPI-stained cell nuclei. (Scale bar, 100 μm.) (B) Single-cell expression distributions of PD-L1 in IMM images shown in A. The smoothed histogram shows obvious different expression intensity of PD-L1 in different samples. The red dashed line indicates an assumed positive threshold. (C) Percentages of PD-L1–positive cells were calculated according to the threshold of 300 MNPs/μm2 in B. The normal sample and tumor sample 1 are obviously PD-L1 negative, tumor samples 2 and 3 have low PD-L1 expression, and tumor samples 4 and 5 have high PD-L1 expression. Data are represented as mean ± SEM, n = 7 and 5, 4, 5, 7, and 5 areas for normal sample and tumor samples 1, 2, 3, 4, and 5, respectively.

