Fig. 3.
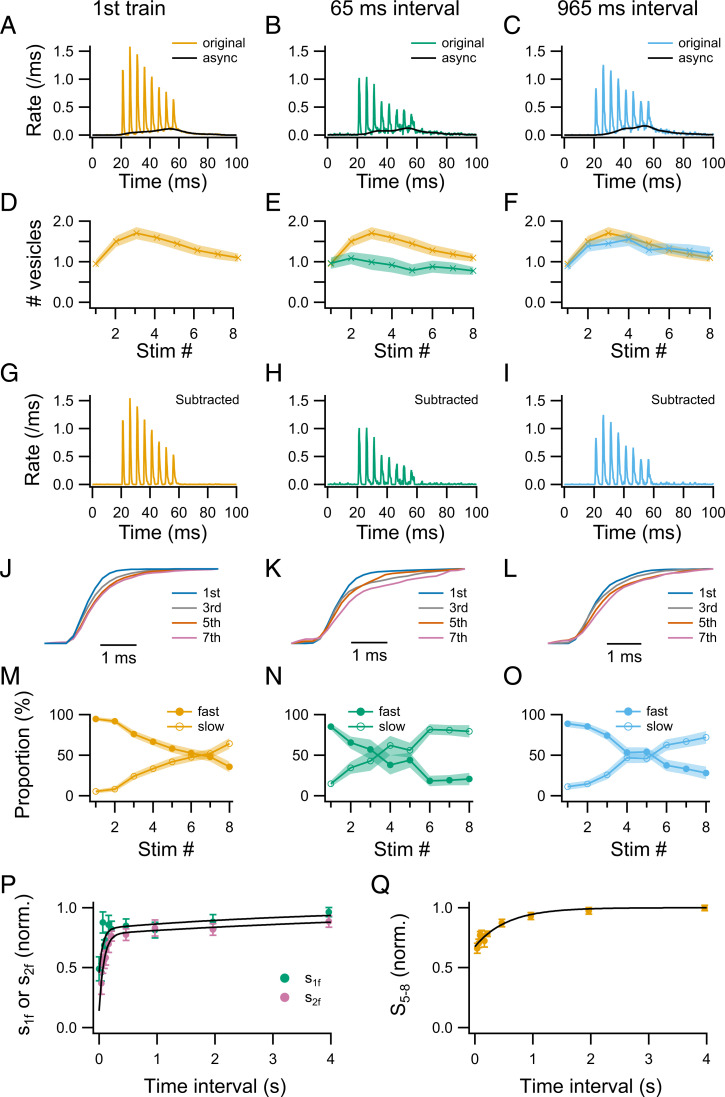
Recovery kinetics of s1f, s2f, and S5–8 after an 8-AP train. (A–C) The overall release rates (original) and the associated asynchronous component (async), averaged from 15 (A), 9 (B), and 13 (C) synapses. The first AP train serves as control (A). Test trains at different intervals (B: 65 ms; C: 965 ms) examine the time course of recovery of different SV pools. (D–F) The number of released SVs following individual APs. Control data are shown together with test 65- and 965-ms intervals for comparison. (G–I) The synchronous release component, obtained by subtracting the asynchronous component from the overall release rate in A–C. (J–L) Overlay of cumulative synchronous release for AP number 1, 3, 5, and 7. Traces have been scaled vertically to have the same amplitude so that the release kinetics after individual APs can be compared. (M–O) Fast and slow components of synchronous release as a function of AP number. (P) The numbers of rapidly releasing SVs after the first AP (s1f, representing δ) and after the second AP (s2f, representing ρ) of the second train plotted against intertrain interval. All values had been normalized to those of the first train. Plots were fitted with a double-exponential function with time constants 67 ms (68%) and 4.0 s (32% of the total amplitude) for s1f, and 83 ms (64%) and 6.6 s (36% of the total amplitude) for s2f. (Q) The summed number of SVs released between AP 5 and 8 of the second train (S5–8, representing the upstream pool size), normalized to that during the first train, and plotted against intertrain interval. Plot was fitted with a single exponential function having a time constant of 550 ms. n = 9 to 15 synapses for each time interval.

