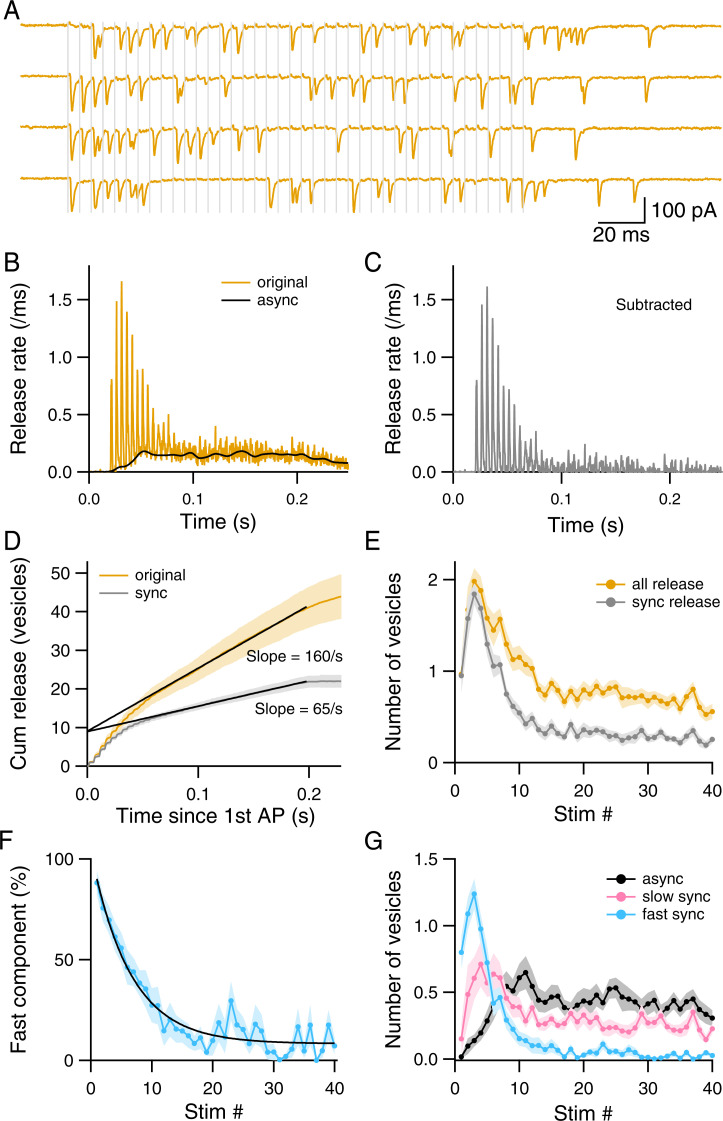
Fig. 4.
Dynamic redistribution of three components of SV release during a 40-AP train. (A) Exemplar recordings showing EPSCs in response to trains of 40 APs evoked at 200 Hz (gray vertical lines). (B) Average release rate from 14 experiments. (C) Synchronous release rate, obtained by subtracting asynchronous release from total release in B. (D) Cumulative release curves for synchronous and total release. Linear fits to the late parts of the curves yield limiting slopes of 65 SV/s for synchronous release and 160 SV/s for total release. (E) The number of released SVs associated with synchronous release and with total release plotted against AP number. (F) Fast component of synchronous release as a function of AP number. Plot was fitted with an exponential function with a time constant of 6.4 stimuli and a steady-state value of 8%. (G) The number of released SVs associated with fast synchronous release, slow synchronous release, and asynchronous release, plotted against AP number.

