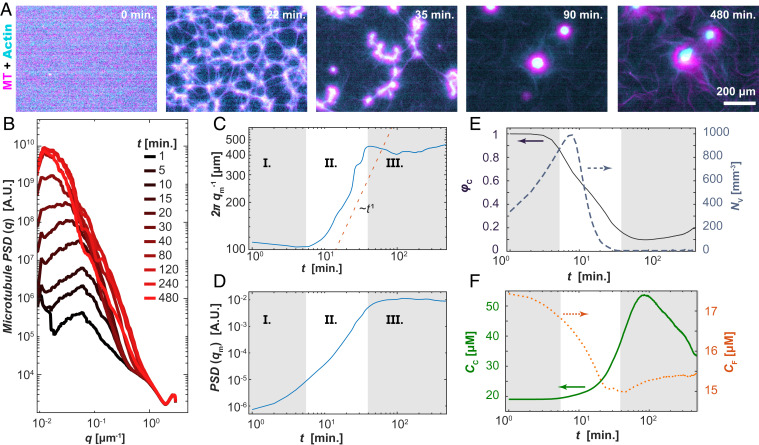
Fig. 3.
Structure of self-organized layered asters. (A) Time series showing a uniform composite phase separating into filament-rich aster and filament-poor extensile fluids (Movie S4). (B) The PSD, PSD(q), of the MT fluorescence micrographs shows the emergence of a peak with increasing time. (C) The position of the inverse of the PSD peak density, qm−1, plotted against time exhibits three stages of phase separation. (D) The magnitude of the PSD peak is plotted as a function of time. (E) Time-dependent fractional area of the contractile domain (solid line; left axis) and the number density of the interstitial extensile fluid domains (dashed line; right axis) extracted from real-space images. (F) The combined F-actin and MT concentration within the contractile aster phase (solid line; left axis) and active fluid phase (dotted line; right axis) as a function of time. Samples contained 100 µM caged ATP, 1.3 mg/mL MTs, and 3 µM actin.

