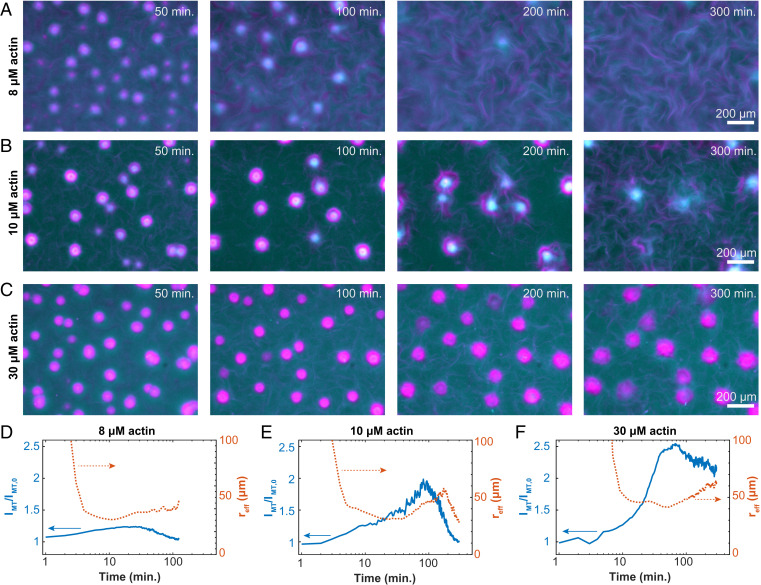
Fig. 4.
Programmable finite lifetime of layers asters. (A–C) Time-lapse images show the structural changes of contracted asters embedded in an active fluid at 8, 10, and 30 µM F-actin (Movie S6). (D–F) Normalized MT fluorescence intensity within the contracted aster phase (solid line; left axes) and equivalent spherical radius of aster domains (dashed line; right axes) show how temporal evolution depends on actin concentration (8, 10, and 30 µM actin).

