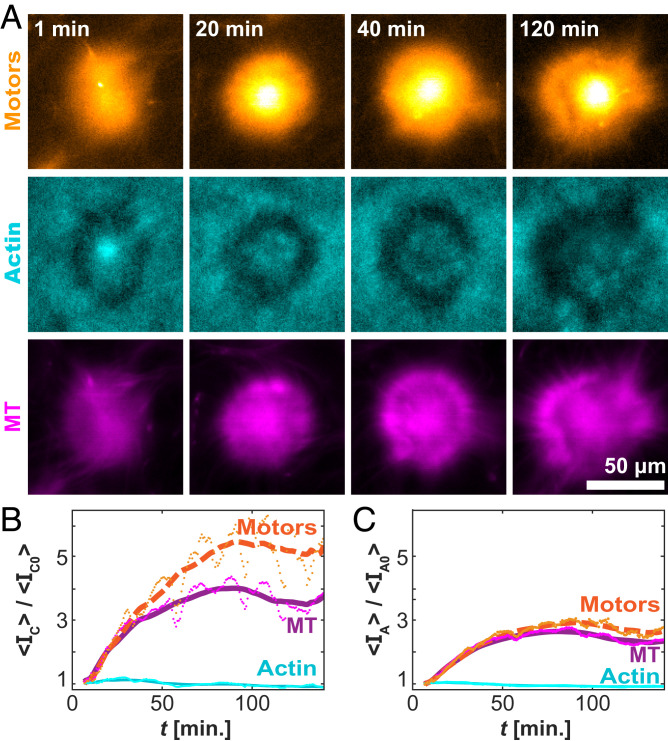
Fig. 6.
Temporal evolution of the aster structures. (A) Time-lapse images of a single aster for the motor (Top), actin (Middle), and MT (Bottom) channels. (B) Time evolution of the normalized mean intensity within 6.5 µm of the centroid. (C) Time evolution of the normalized intensity over the entire contracted domain. Lines represent a moving average over 20 min. Data are from 300 µM caged ATP, 6 µM actin, and 100 µM caged ATP.

