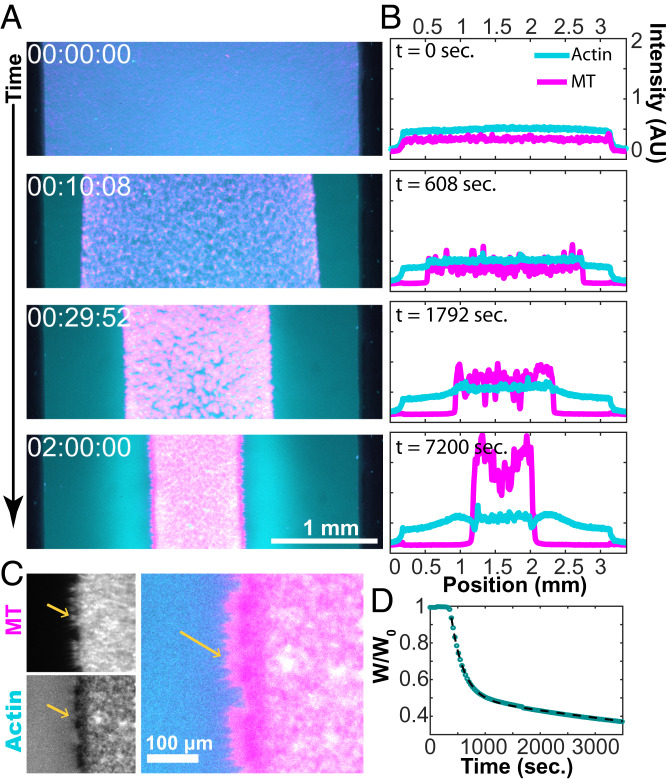
Fig. 8.
Bulk contraction at high F-actin concentrations. (A) Dual-color fluorescence micrographs of actin (cyan) and MTs (magenta) show the MT-rich network contract toward the chamber interior (Movie S9). (B) Intensity profiles of fluorescence micrographs show the accumulation of F-actin and MTs during bulk contraction. While nearly all of the MTs are carried in the contracting structure, a significant fraction of F-actin is left behind. (C) MT bundles point outward from the contracted domain. (D) A plot of the normalized width as a function of time. The fit to Eq. 1 yields c1 = 203 s and c2 = 3,470 s, and the lag time b = 269 s.

