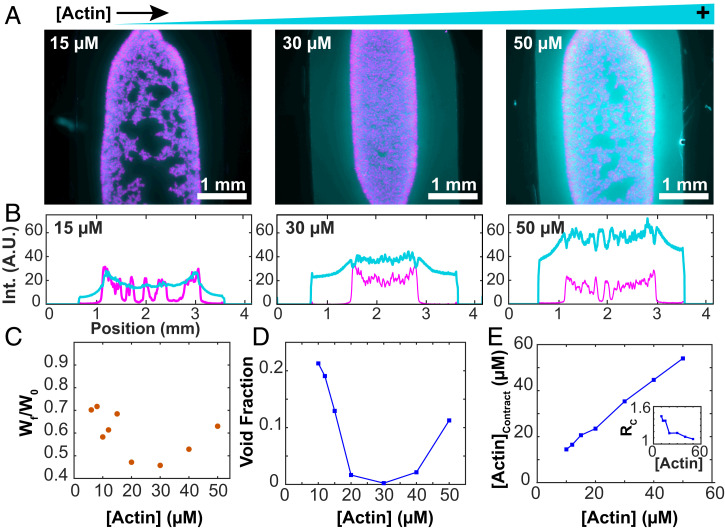
Fig. 9.
Bulk contraction changes nonmonotonically with F-actin concentration. (A) Fluorescence micrographs of bulk-contracted domains at various F-actin concentrations. Images represent the densest structures formed. (B) Profiles of the intensity of the actin and MT signals across the sample chamber. (C) The normalized width of the final contracted structures varies nonmonotonically with the F-actin concentration. (D) The void fraction of MTs within the contracted structures depends on the F-actin concentration. (E) Increasing overall F-actin concentration increases the concentration of F-actin within the contracted domains. (Inset) The ratio of F-actin concentration in and outside the contracted domains.

