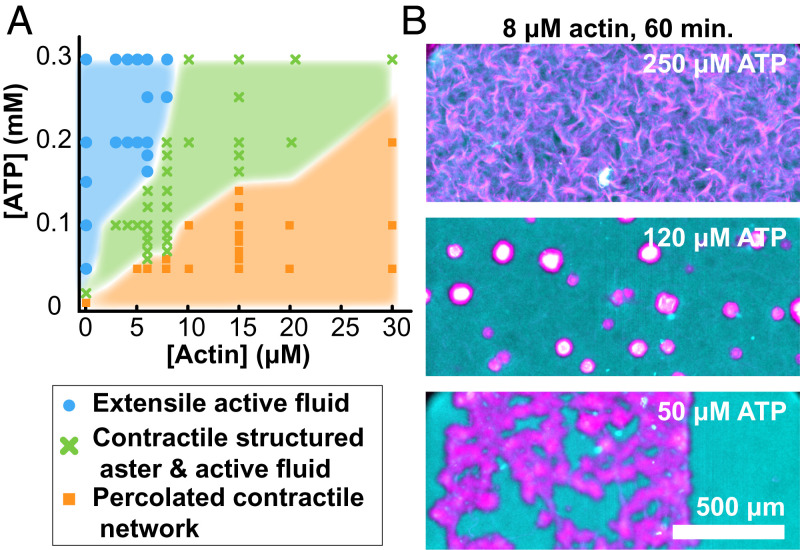
Fig. 10.
Dynamics phase diagram of actin–MT active composites. (A) State diagram representing the self-organized structure observed after 1 h of activity as a function of ATP and F-actin concentration. Bulk contraction is characterized by the retraction of the sample edges before self-tearing into localized structures. (B) Representative merged fluorescence micrographs of the active composite demonstrating self-organized structure at fixed actin concentration while varying ATP concentration (MT, magenta; F-actin, cyan).

