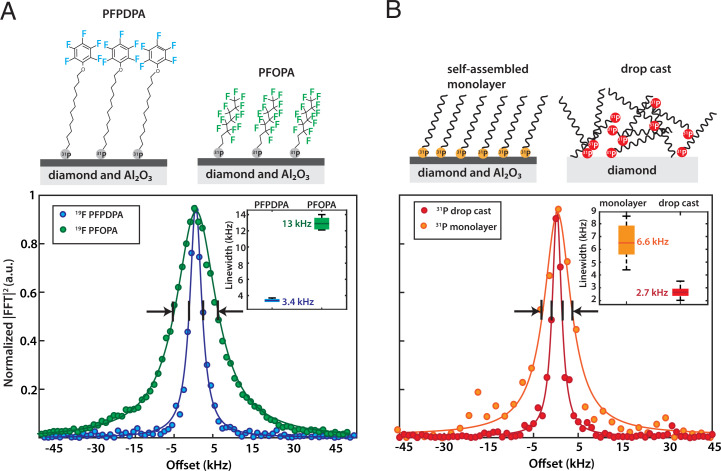
Fig. 4.
Spectroscopic characterization of the SAM layer. (A) Influence of molecular structure on 19F resonance linewidth. The 19F linewidth of a monolayer made from PFOPA is approximately four times broader than that of PFPDPA. This is likely caused by local dynamics of the fluorinated phenolic moiety, which lead to line narrowing of the NMR signal. (Inset) Statistics over three experiments. The green and blue bars show one SD for the PFPDPA and PFOPA monolayers. The darker green and blue lines indicate the mean. The black lines are the minimum and maximum obtained linewidths. (B) Comparison of the 31P linewidth for a SAM layer (Left) and a drop cast sample (Right). The 31P linewidth in the case of a SAM layer is more than two times broader than that of the drop cast sample. (Inset) Statistics over eight repeated experiments. The orange and red bars show one SD for the monolayer and drop cast, respectively. The darker orange and red lines indicate the mean. The black lines are the minimum and maximum obtained linewidths.

