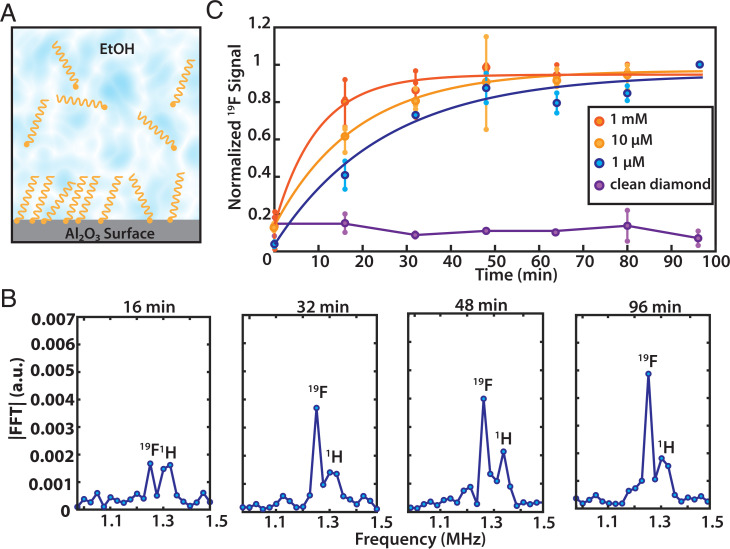
Fig. 6.
Probing surface chemistry in situ. (A) Schematic of monolayer formation on Al2O3 in PA solution. (B) Individual spectra of 19F showing the time evolution for a 1-µM solution. The peak around 1.35 MHz can be assigned to protons (1H) which are known to be ubiquitous on or within the diamond and are not characteristic of the surface chemistry. (C) Real-time monitoring of the 19F NMR signal amplitude growth in solution for three different PA concentrations shows a decrease in formation rate for lower concentrations. Small markers are measured data points of repeated experiments connected with a vertical line, averaged data are shown with the large points. Data points are fitted with a single exponential. Background signal of a clean, non-Al2O3–coated diamond in a 10-µM PA solution shows no 19F signal. Note that due to the absolute value of the Fourier transformation, the noise floor is always positive.

