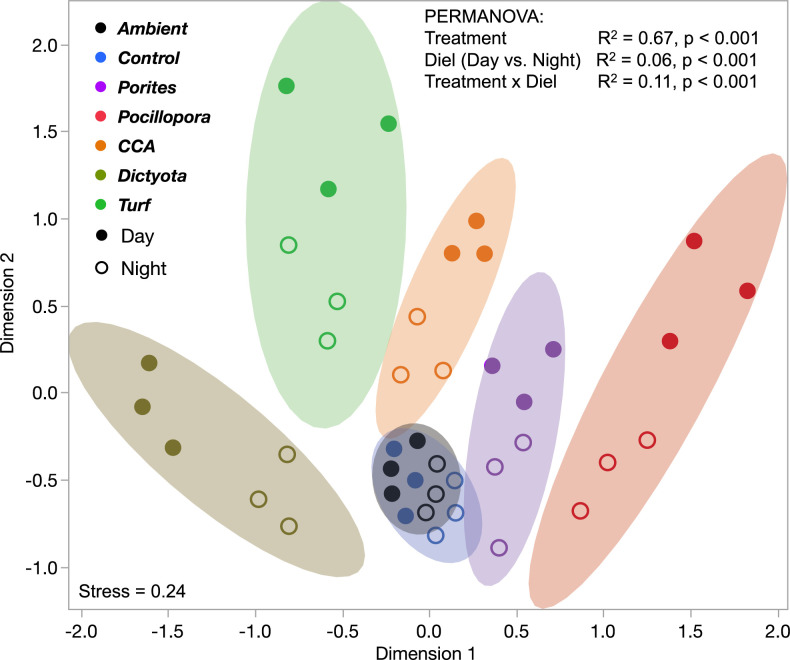
Fig. 2.
Ordination of daytime and nighttime incubation samples according to relative abundance of exometabolite features. Bivariate normal density ellipses contain 90% of the data. Relative abundances of each exometabolite feature (n = 1,667) in each sample were angular transformed to approximate Gaussian distributions and then standardized via z-scoring before ordinating via multidimensional scaling (aka principal coordinates analysis). Results of permutational ANOVA via the adonis function in the vegan package in R are presented at top. All treatment pairwise comparisons are P < 0.01 except Ambient-Control P = 0.13.

