Fig. 4.
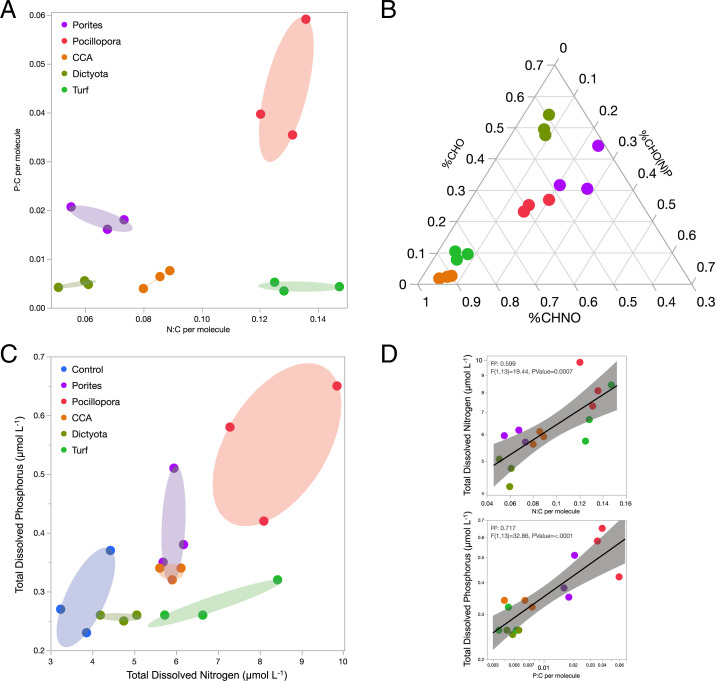
Exometabolite feature N and P stoichiometry predicts bulk N and P release by benthic producers. (A) Weighted mean N:C and P:C per molecule mapped among triplicate daytime exometabolite feature samples is coordinated with the (B) Ternary plot of proportional weighted mean relative abundance of three stoichiometric classes of exometabolite features. (C) Total dissolved N and P (micromolar) released from primary producers in triplicate daytime incubations is coordinated with the organic nutrient stoichiometry of exometabolite features. (D) The weighted average N:C and P:C of exometabolite features (from 4A) predict the concentrations of N and P (from 4C), respectively.

