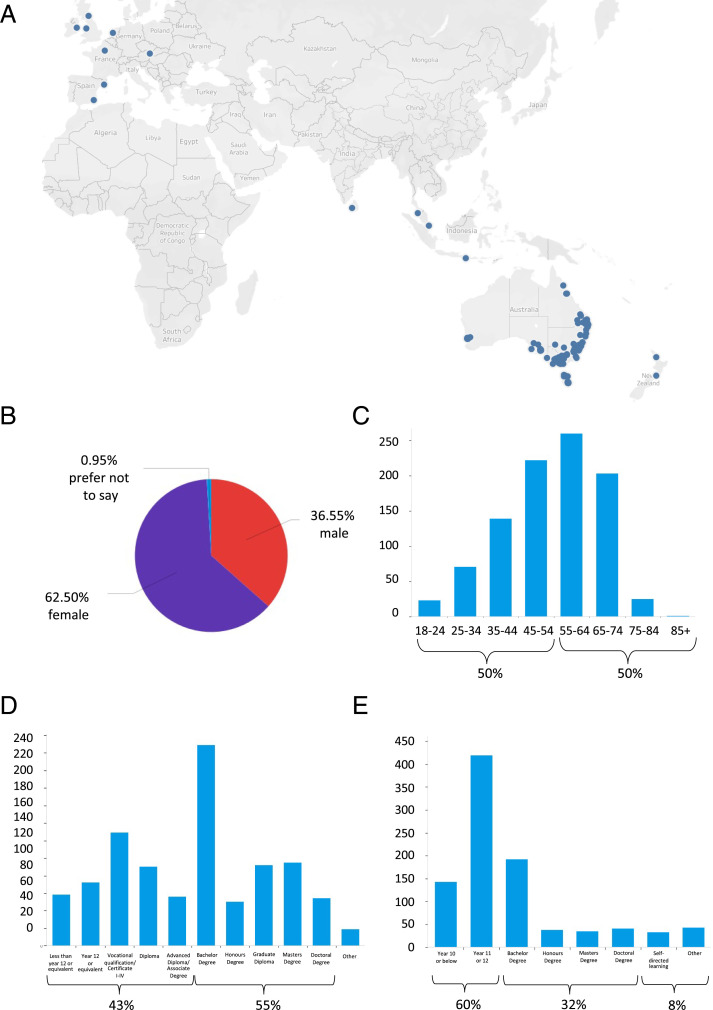
Fig. 5.
Survey demographic information of EchidnaCSI participants. (A) Locations from which participants took the survey shown in blue. (B) Pie chart of gender. (C) Histogram of ages, showing the percentages of participants that were under the age of 55 and those that were 55 y and older. (D) Histogram of level of education, showing percentages of those that had an education below a Bachelor’s degree and those that had at least a Bachelor’s degree or higher. (E) Histogram of level of science education, showing percentages of those that had up to a high school–level (max year 12) science education and those that had a Bachelor’s degree or above in Science.

