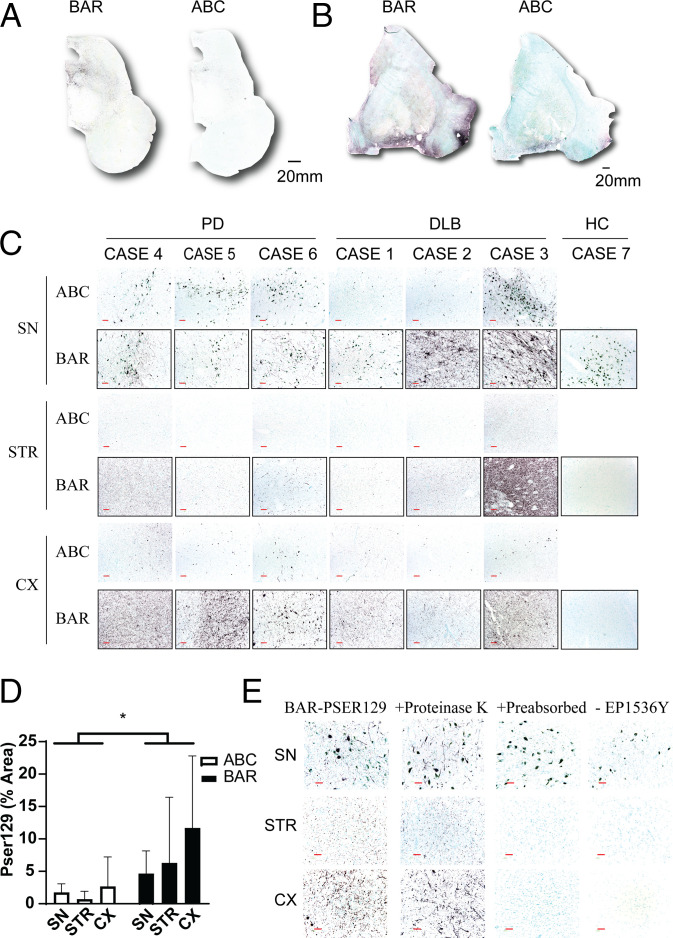
Fig. 2.
BAR labeling of LP in the synucleinopathy brain. Formalin-fixed floating sections from midbrain and sections adjacent to the anterior commissure of individuals with PD (n = 3), DLB (n = 3), and nonsynucleinopathy controls (HC, n = 3) were labeled using the BAR-PSER129 technique or a standard ABC detection protocol. The distribution of labeling was detected using nickel DAB chromogen. All slides were counterstained with the nuclear stain methyl green. Whole slide scans at 10× magnification of (A) midbrain and (B) putamen sections showing distribution and intensity of BAR labeling and standard ABC detection. (C) The 20× images of regions of interest including the SN, cortex (CX), and striatum (STR). (D) Quantification of PSER129 staining in brain regions of interest. *Two-way ANOVA F(1,30) = 7.008, P = 0.0128. Sections with either BAR-PSER129 or standard ABC were quantified and compared. (E) Assay controls for the BAR-PSER129 labeling. Tissue sections were processed under varying conditions including 1) pretreating tissue with proteinase K, 2) using EP1536Y anti-PSER129 antibody that was preabsorbed with excess immunogen, or 3) omitting the EP1536Y anti-PSER129 antibody from the protocol. Representative 20× images from regions of interest show resulting labeling under each condition. (Red scale bars, 100 μm.)

