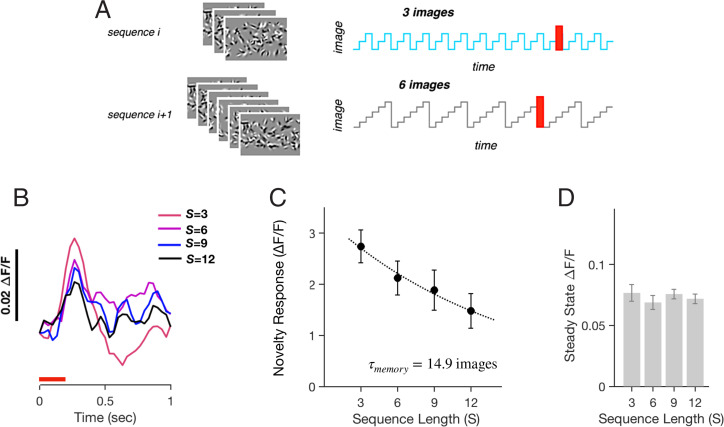
Fig. 6.
Novelty response from within larger image sets. (A) Image sets with either S = 3, 6, 9, or 12 images were presented 17 times before one of the images was substituted by a unique novel image. All images were presented for 300 ms each. (B) Trial-averaged response of the neural population to novel images during image sets of different size, S (shown in color). (C) Amplitude of the novelty response versus image set size, S. Dotted line is an exponential curve fit; error bars are SEM for n = 5 mice. (D) Population-averaged steady-state neural activity versus image set size, S; error bars are SEM for n = 5 mice.

