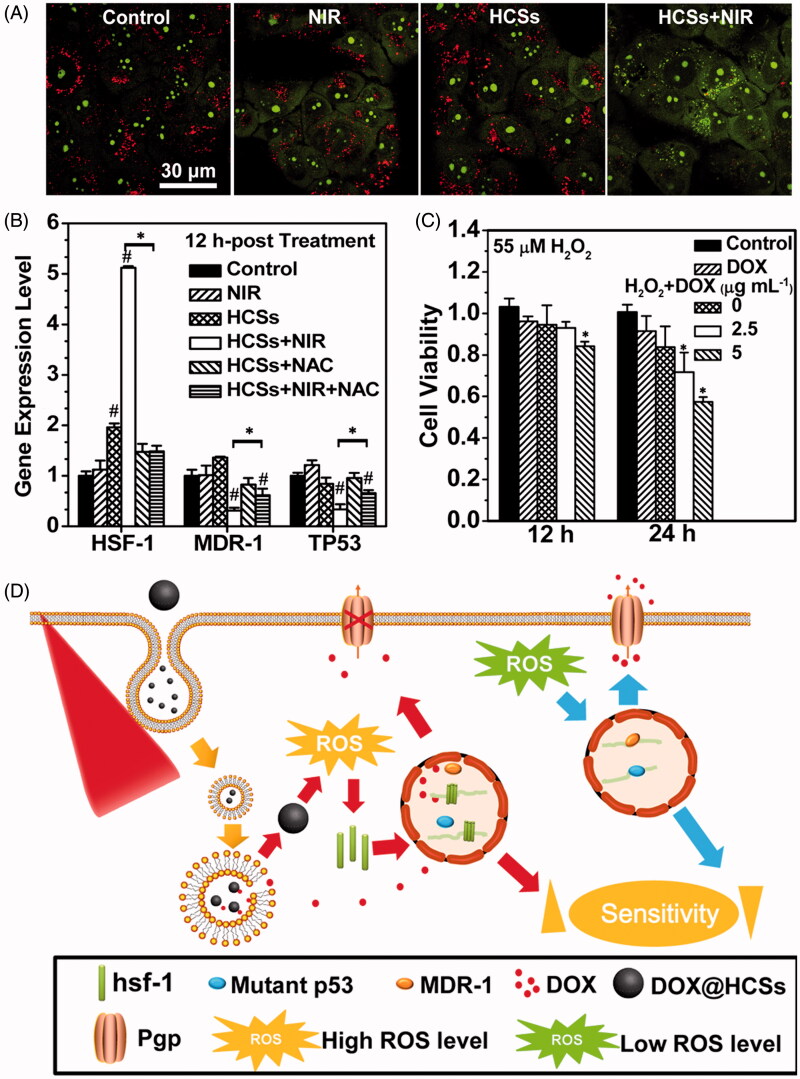
Figure 3.
(A) Changes in the lysosomal membrane permeation induced by the photothermal effects determined by AO staining. (B) Impact of intracellular ROS levels on the expression of HSF-1, MDR-1 and TP53 genes. The asterisk (*) shows significant differences between test samples and the sample under laser irradiation (HCSs + NIR) (p < .05); the pound symbol (#) indicates significant differences between test samples and the control. (C) Change in the DOX sensitivity of MCF-7/ADR cells treated with 55 μM H2O2. Asterisk (*) indicates significant differences between control and test samples. (D) Combatting the chemotherapeutic resistance of cancer using HCSs under NIR laser irradiation. (Reprinted with permission from (Wang et al., 2015c), copyright 2015 American Chemical Society).

