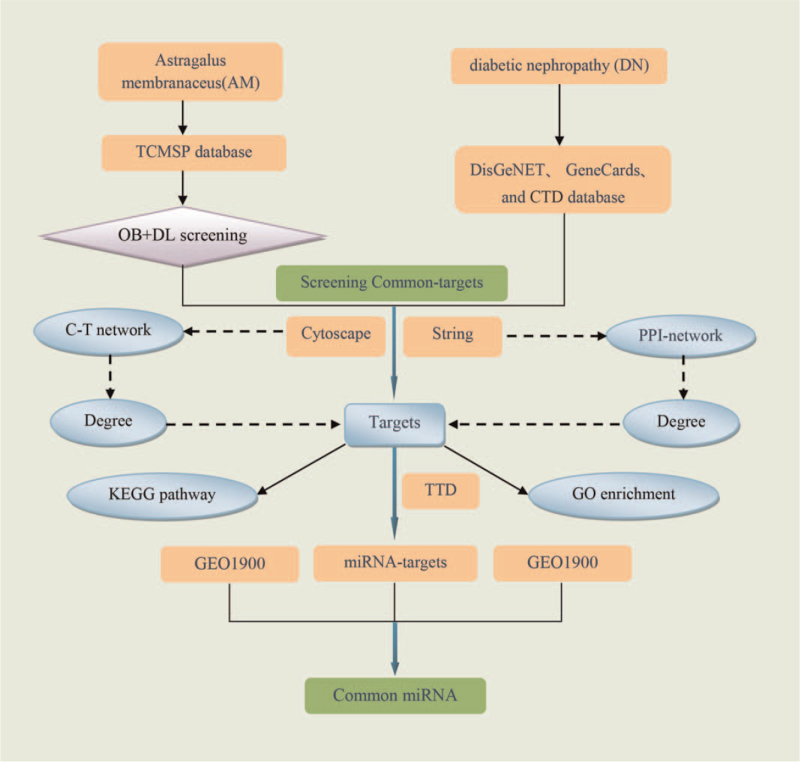
Figure 1.
Flowchart of the network pharmacology analysis. CTD = Comparative Toxicogenomics Database, DL = drug-likeness, OB = oral bioavailability, PPI = protein–protein interaction, GEO = gene expression, omnibus, GO = gene ontology, KEGG = Kyoto encyclopedia of genes and genomes, miRNAs = microRNAs, TCMSP = traditional Chinese medicine systems pharmacology database, TTD = therapeutic target database.

