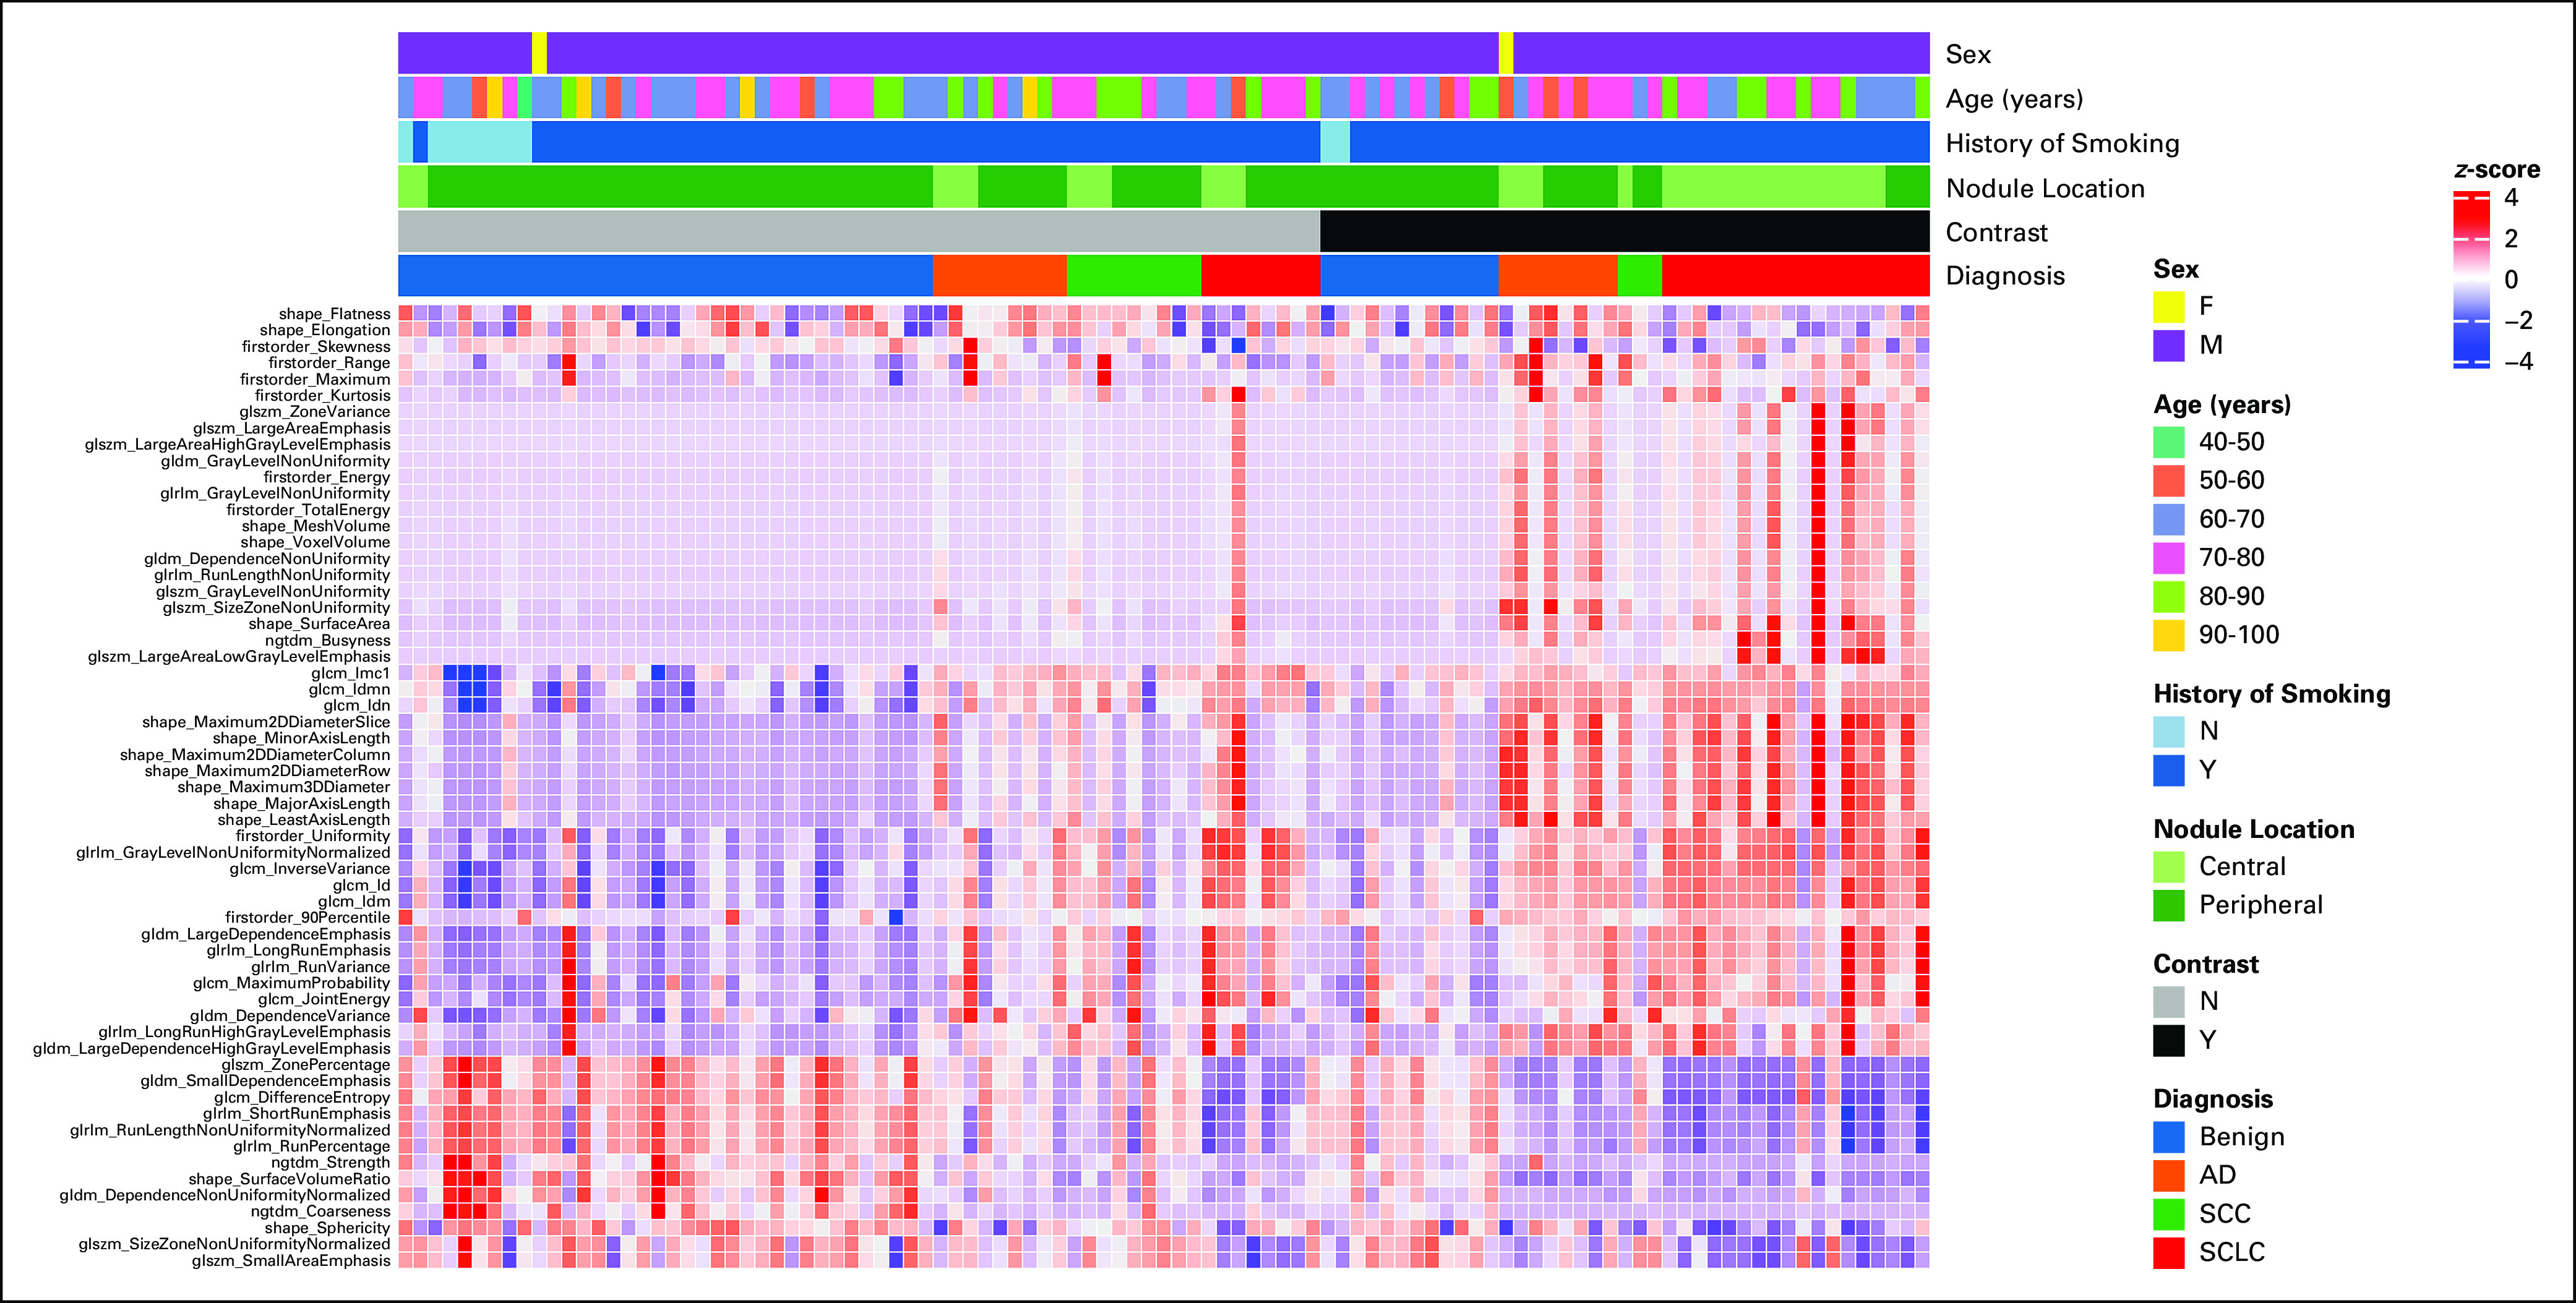
FIG 2.

Heatmap demonstrating radiomic feature Z-score values for benign, SCLC, adenocarcinoma, and SCC across 59 features with a high intraclass correlation between two segmenters. Each column represents a unique patient. Contrast usage shows a different Z-score distribution for malignant tumors compared with benign lesions and NC scans. Therefore, separate models were generated for the use of contrast versus NC studies. AD, Adenocarcinoma; F, female; M, male; N, no; NC, noncontrast; SCC, squamous cell cancer; SCLC, small-cell lung cancer; Y, yes.
