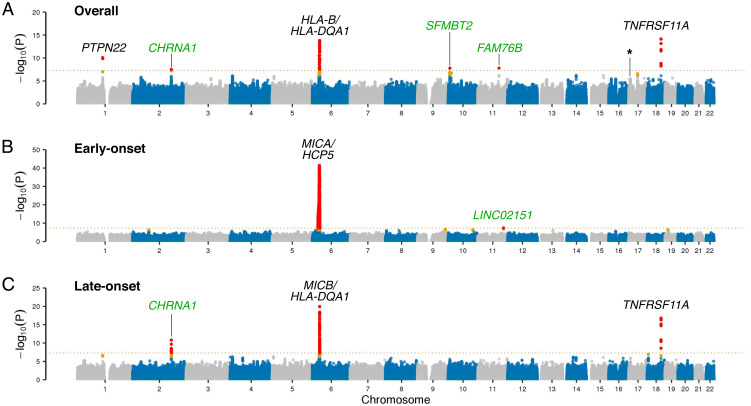
Fig. 2.
GWAS in myasthenia gravis. The Top (A), Middle (B), and Bottom (C) panels show the Manhattan plots depicting the GWAS results of the overall discovery cohort (n = 1,873 myasthenia gravis cases and 36,370 control individuals), the early-onset cohort (n = 595 cases and 2,718 controls), and the late-onset cohort (n = 1,278 cases and 33,652 controls). The x-axis denotes the chromosomal position for the autosomes in hg38, and the y-axis indicates the association P values on a −log10 scale. Each dot represents a variant, where red dots denote variants that reached genome-wide significance and orange dots denote variants that are one log-fold lower than the significant threshold. A dashed line shows the conservative Bonferroni threshold for genome-wide significance (P = 5.0 × 10⁻⁸). Black font highlights known risk loci, while green font indicates association signals identified in this study not previously reported. The subsignificant hit on chromosome 17 corresponding to the CHRNB1 locus is marked with an asterisk.

