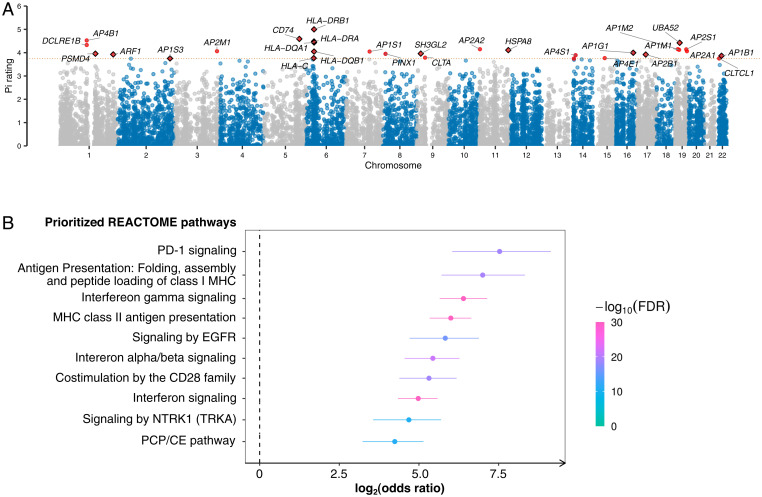
Fig. 4.
Prioritization of immunological targets in myasthenia gravis based on Priority Index and druggability. (A) Autosomal genes were scored based on the gene-predictor matrix generated from the Priority Index pipeline. The x-axis denotes the chromosomal position in hg38, and the y-axis indicates the Priority Index rating on a scale of 0 to 5. Each dot represents a gene, and the red dots indicate the top 30 genes. Dots with a black diamond outline are druggable genes based on a Pocketome analysis. The red dashed line shows the threshold for the top 30 genes (scale > 3.9). (B) An enrichment analysis shows the prioritized target pathways in the immune and the signal transduction modules. The x-axis shows the REACTOME pathways that were significantly overrepresented by the top genes. The y-axis denotes the strength of the enrichment quantified by the OR on a log2 scale. The 95% CIs are represented by lines flanking each dot. Enrichment significance was measured by calculating the false discovery rate (FDR) from a one-sided Fisher’s exact test.

