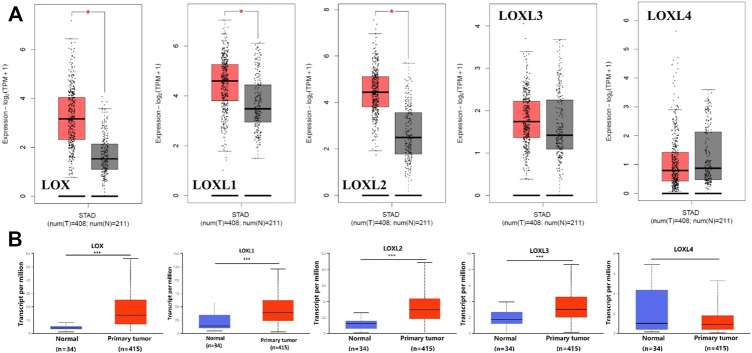
FIGURE 2.
Boxplot showing the expression levels of LOX family inGC. (A) GEPIA analysis. The number of normal samples are 211 (grey box), and number of primary tumor samples are 408 (red box), red star means p < 0.01; (B) UALCAN analysis. The number of normal samples are 34 (blue box), and number of primary tumor samples are 415 (red box) ***p < 0.001.

