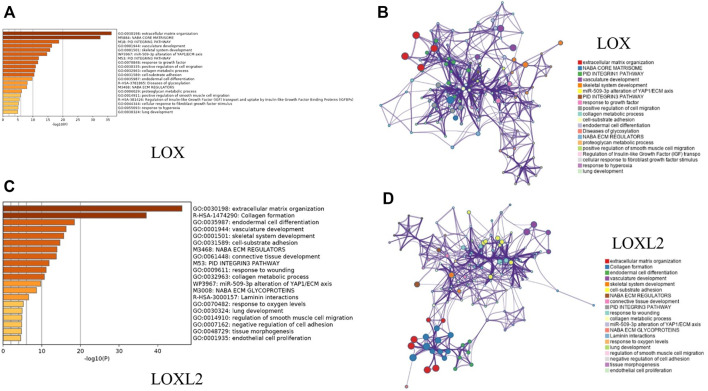
FIGURE 6.
Functional enrichment analysis of genes co-expressed with LOX and LOXL2 using Metascape. (A,C) Heatmaps of the molecular functions, biological processes, or pathways enriched with LOX and LOXL2 co-expressed genes. The bar color shade was decided by the p value, the deeper the shade, the less the p value. (B,D) Networks exhibiting interactions among the clusters of genes enriched in the molecular functions, biological processes, or pathways presented in the heatmaps. The points in different colors represented clusters of genes enriched in different molecular functions, biological processes, and pathways.

