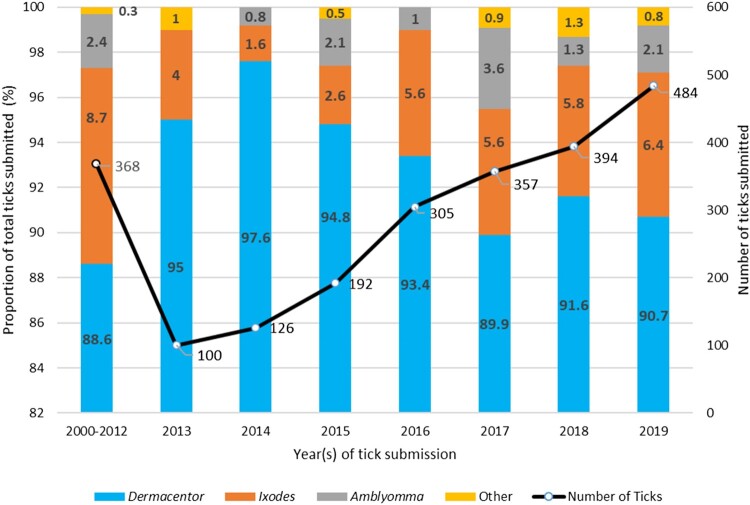
Figure 1.
Number of ticks submitted over time and proportional representation of genera in teach time category (n = 2,326 ticks). Data values in bold font represent proportions in the specific year(s) indicated. Data values that are not bolded represent numbers of ticks submitted in the year(s) indicated.

