
Figure 1.
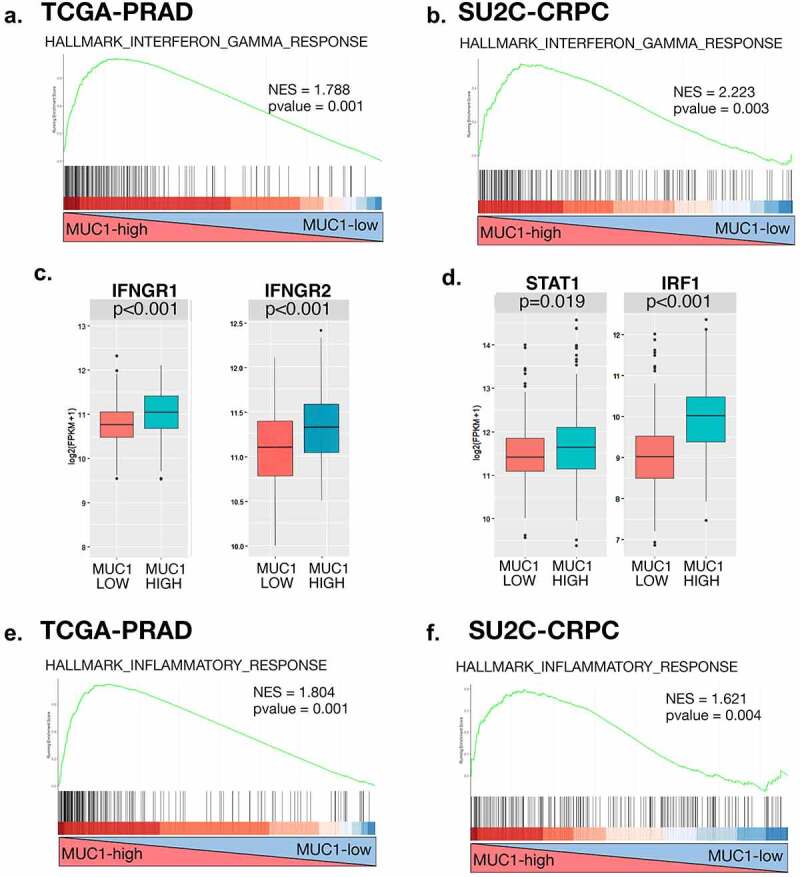
Expression of MUC1 in PC tumors associates with chronic activation of the type II IFNG pathway. (a and b). Enrichment plots for the HALLMARK INTERFERON GAMMA RESPONSE pathway, comparing MUC1-high to MUC1-low PC tumors in the TCGA-PRAD (a). and SU2C-CRPC (b). cohorts. (c and d). Normalized expression data for the TCGA-PRAD cohort were downloaded from cBioPortal, and median expression used to group samples into MUC1-high and MUC1-low groups. Expression of IFNGR1 and IFNGR2 (c). and downstream STAT1 and IRF1 (d). genes was assessed in MUC1-high and MUC1-low groups using a Wilcoxon rank-sum test. Boxplots represent the 1st quartile, median and 3rd quartile of each distribution. Whiskers extend to the maximum and minimum values up to 1.5*interquartile range (IQR). (e and f). Enrichment plots for the HALLMARK INFLAMMATORY RESPONSE pathway, comparing MUC1-high to MUC1-low PC tumors in the TCGA-PRAD (e) and SU2C-CRPC (f) cohorts.