
Figure 1.
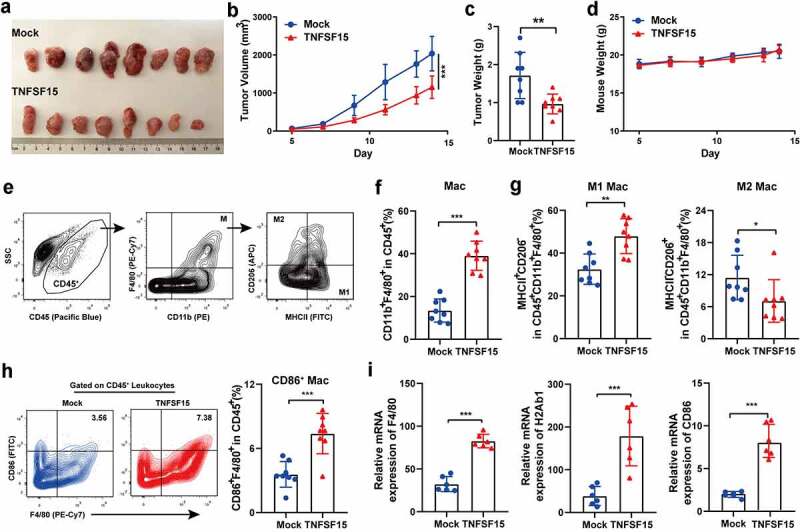
TNFSF15 promotes M1 macrophages infiltration into the tumor. A The picture of TNFSF15-overexpressing LLC tumors (TNFSF15) and the control tumors (Mock) on day 14, n = 8. The volume (b) and weight (c) measurement of TNFSF15 and Mock tumors, n = 8. D The weight of mice was monitored from day 5 to day 14, n = 8. E Flow cytometric analysis of macrophages (CD45+CD11b+F4/80+), M1 macrophages (CD45+CD11b+F4/80+MHCII+CD206−), M2 macrophages (CD45+CD11b+F4/80+MHCII−CD206+) in tumor. Quantification of the percentages of macrophages within CD45+ fraction (f), M1 macrophages, and M2 macrophages within CD45+CD11b+F4/80+ fraction (g) in TNFSF15 and Mock tumors, n = 8. H Flow cytometric analysis and quantification of CD86+ macrophages within CD45+ fraction in TNFSF15 and Mock tumors, n = 8. I qPCR analysis of gene expression of F4/80, H2Ab1 (MHCII) and CD86 in TNFSF15 and Mock tumor tissues, n = 6. The data are presented as the mean ± SD, *P < .05, **P < .01, ***P < .001.