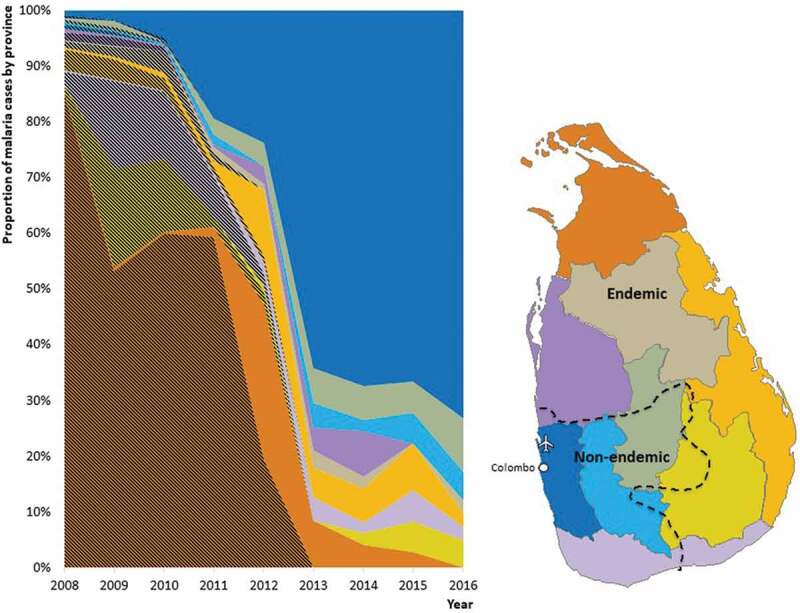
Figure 4.

Title: Geographical transition in the areas where malaria is being detected and reported.
On the right is a map of Sri Lanka showing provinces shaded in different colors, and an interrupted line demarcating the previously endemic (to the right of the line) and previously non-endemic (to the left of the line) areas. The capital city of Colombo and the international airport have been shown in white. In the chart on the left, the proportion of yearly reported malaria cases in Sri Lanka from 2008 to 2016 are shown by province in colors corresponding to the colors of provinces in the map. The proportion of indigenous malaria cases are shown by hatched overlay on the color, and imported malaria cases in plain color (unhatched).
