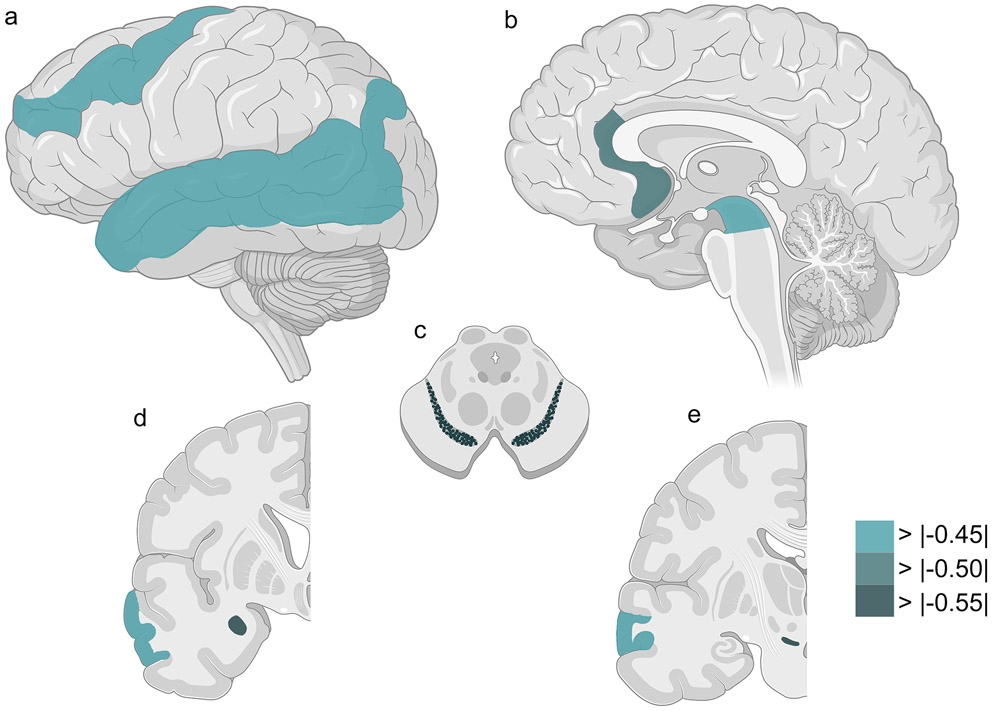
Fig. 3.
Seven brain regions show nominally-significant associations between severity of TDP-43 pathology and TMEM106B genotype under a major (T)-allele-dominant model in ALS. Lateral (a), sagittal (b), cross-sectional (c), and coronal (d, e) sections of CNS regions are shown. Colors reflect the effect size (calculated coefficients) for TMEM106B genotype on TDP-43 pathology across all ALS cases, ranging from weak effects (light green) to strong effects (dark green). See Table 4 for additional details.

