. 2022 Feb 4;71(5):177–181. doi: 10.15585/mmwr.mm7105e1

FIGURE 1.

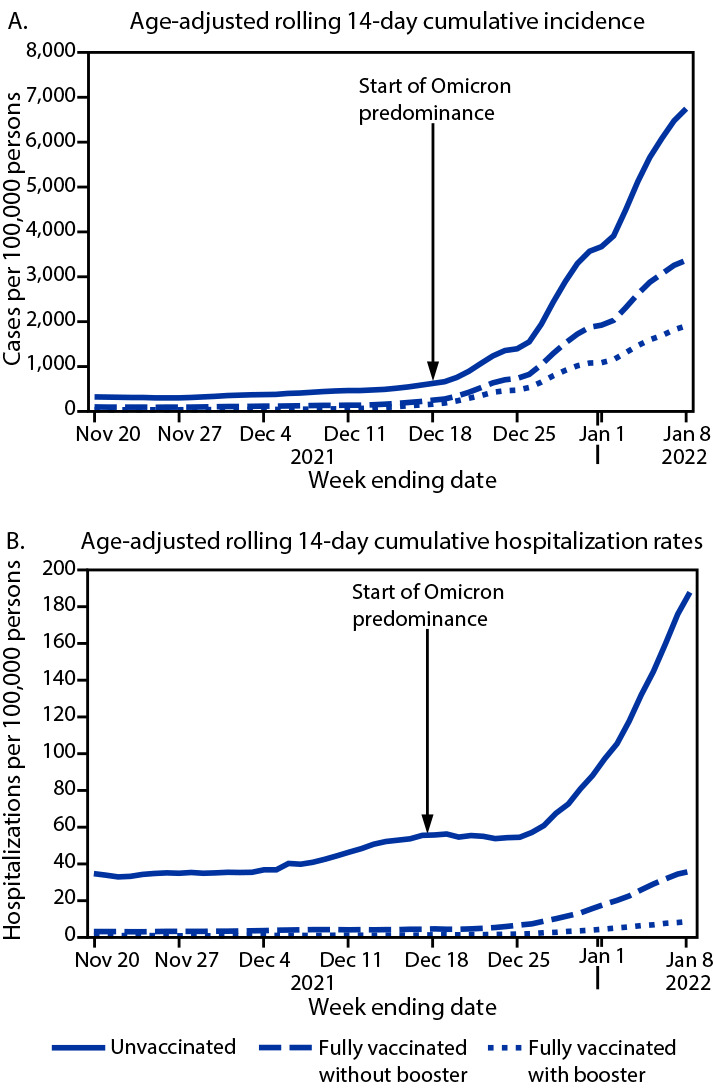
The figure is a pair of line graphs indicating the age-adjusted rolling 14-day SARS-CoV-2 cumulative incidence in panel A and hospitalization rates in panel B, by vaccination status in Los Angeles County, California during November 7, 2021–January 8, 2022.

Age-adjusted rolling 14-day SARS-CoV-2 cumulative incidence* (A) and hospitalization rates (B), by vaccination status — Los Angeles County, California, November 7, 2021–January 8, 2022

* Rates were estimated using 2019 population estimates and standardized using the year 2000 standard population.