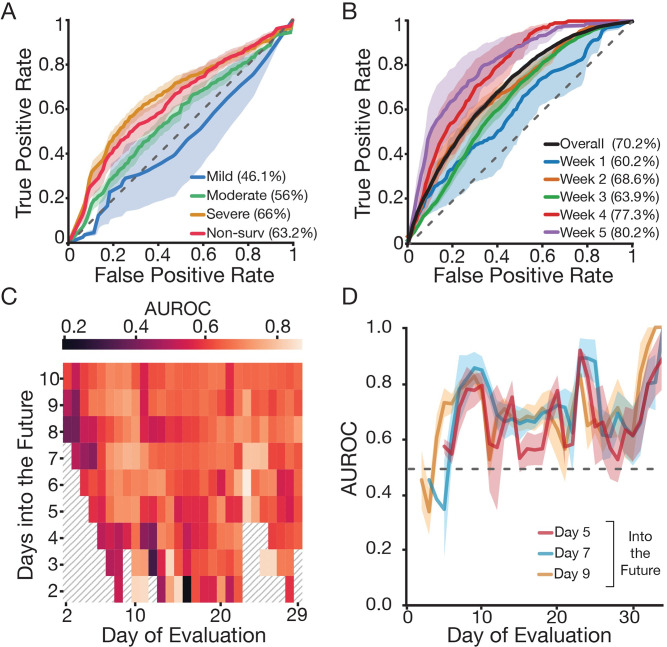
Fig 5. Time-dependent clinical and laboratory data outperform day of admission data to predict fatal outcome.
(A) ROC performance on predicting severity of disease and mortality using a random forest classifier based on data from the EMR (including clinical, laboratory data and demographics; see S7 Fig) on admission. Shaded areas correspond to ± 2 standard error of the mean. (B) ROC performance on predicting mortality within the next five days (k = 5) using a neural network based on time dependent clinical features (IgG titers, total white blood cell count, neutrophils, lymphocytes, eosinophils, platelets, CRP and BUN; see Fig 4). ROC curves correspond to the overall performance (purple) as well as weekly predictions (relative to the patient-reported onset of symptoms) during the length of hospitalization. A-B) Legend describes the corresponding area under the curves. (C) Heatmap shows AUROC for daily mortality classifier (neural network) for different values of k (number of days into the future to predict; y-axis) and day of evaluation (restrict test set to a given day). (D) AUROC as a function of day of evaluation for various values of k. Regardless of k, the performance of the classifier remains consistent and improves over the course of a month. (C-D) We define “day of evaluation” as the day relative to the patient-reported onset of symptoms when mortality risk was assessed. ROC: receiver operating characteristic; EMR: electronic medical record; AUROC: area under the receiver operating characteristic.

