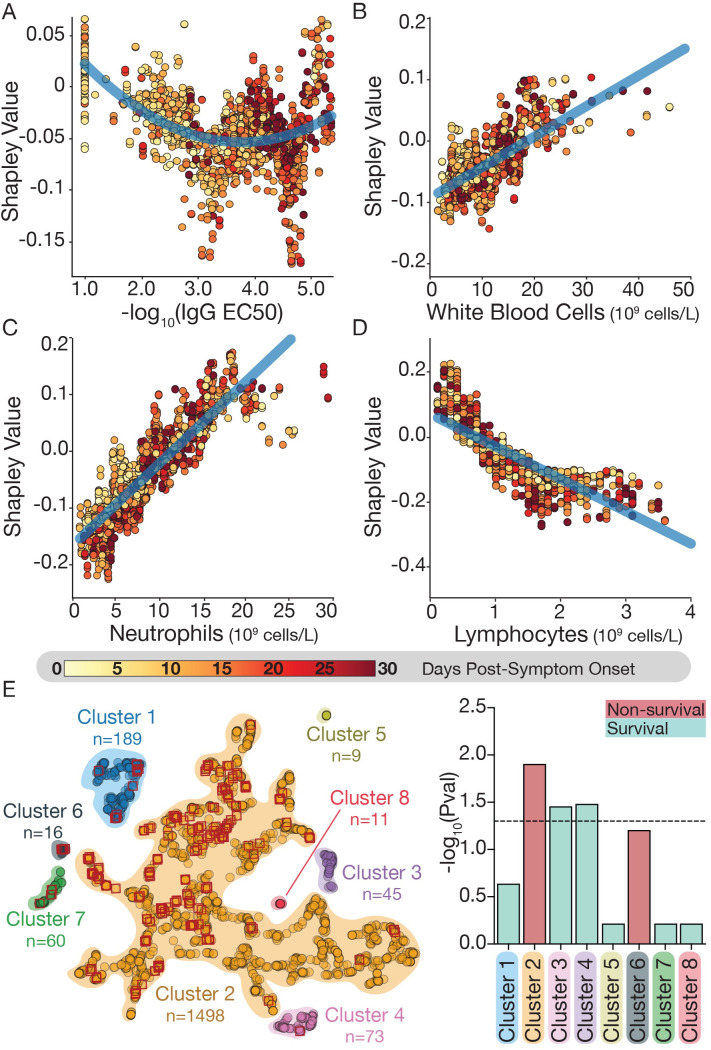
Fig 6. Shapley value analysis reveals how immune biomarkers relate to mortality.
(A-D) For each of 4 immune biomarkers, the mean Shapley value compared to the biomarker value was plotted for each sample in the dataset (see materials and methods for details). The higher the Shapley value, the more the variable is predictive for mortality (and vice-versa): (A) IgG titers; (B) WBC count; (C) neutrophil count; (D) lymphocyte counts. Shapley values are colored based on the corresponding day PSO. (E) UMAP clustering of mean Shapley values. Red diamonds correspond to samples from patients that died within five days (k = 5) of the evaluation day. Right panel describes the significance of the enrichment for survivors (cyan) or non-survivors (red) in each of the obtained clusters using the hypergeometric test corrected for multiple hypothesis testing by Benjamini/Hochberg. Dotted horizontal line corresponds to the significance level at p = 0.05.PSO: post symptom onset.

