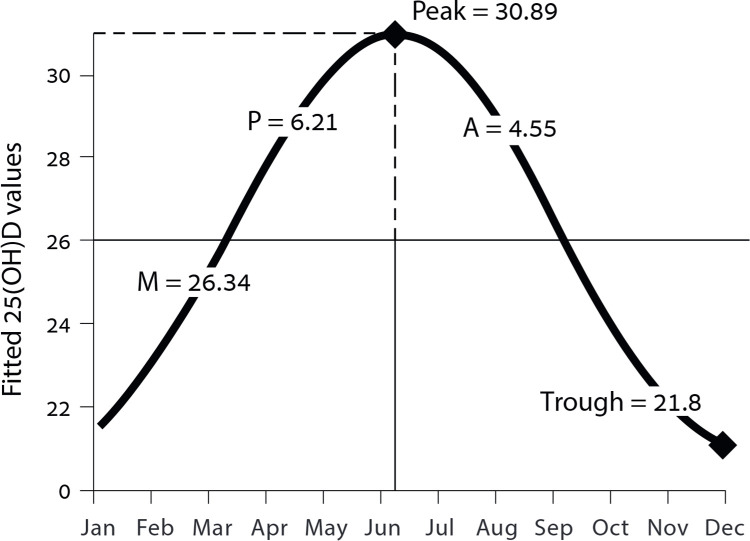
Fig 1. The cosinor 25(OH)D model for all months.
The predicted 25(OH)D mean value of each month through the annum can be extracted from the graph. This figure demonstrates the predicted peak of 25(OH)D concentration in June and the expected trough in December. The predicted 25(OH)D mean value of each month can be utilized to predict the 25(OH)D for the hospitalization month of any given patient (Eq 3). M = mesor, A = amplitude, P = Phase.

