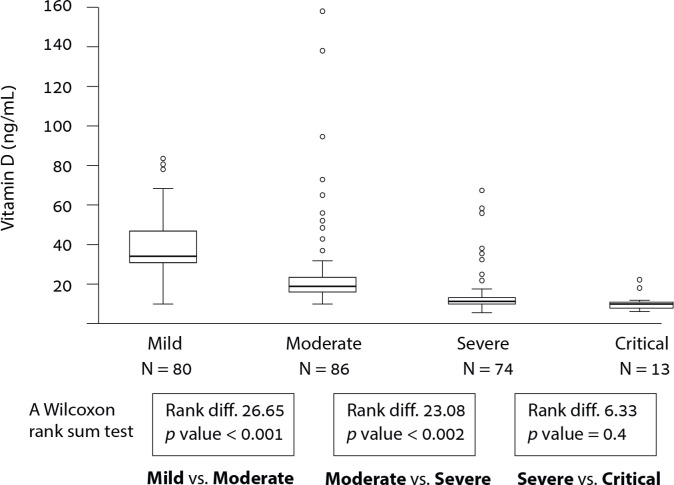
Fig 2. Box-and-whisker plots of the most recent pre-infection serum 25(OH)D levels before hospitalization were collected as a baseline (N = 253).
The mean vitamin level was compared between the four categories of COVID-19 disease severity as determined by the WHO definition (WHO/2019-nCoV/clinical/2020.5). A Kruskal-Wallis test for multiple-category comparison shows a significant difference between groups p < 0.001. A Mann-Whitney test compared vitamin D mean rank of two neighboring categories sequentially; mild compared with moderate (mean difference, 12.96 ng/mL; [Rank difference 26.65] p < 0.001); moderate compared with severe (mean difference, 10.72 ng/mL [Rank difference 23.08]; p < 0.002); Severe compared with Critical (mean difference, 3.96 ng/mL [Rank difference 6.33]; p = 0.40). The boxes present the range of vitamin D values within the interquartile range (50% of the cases). The whiskers outside the box mark the most upper and lower values within 1.5 times the interquartile range. Outliers’ values in each group are represented with empty circles.

