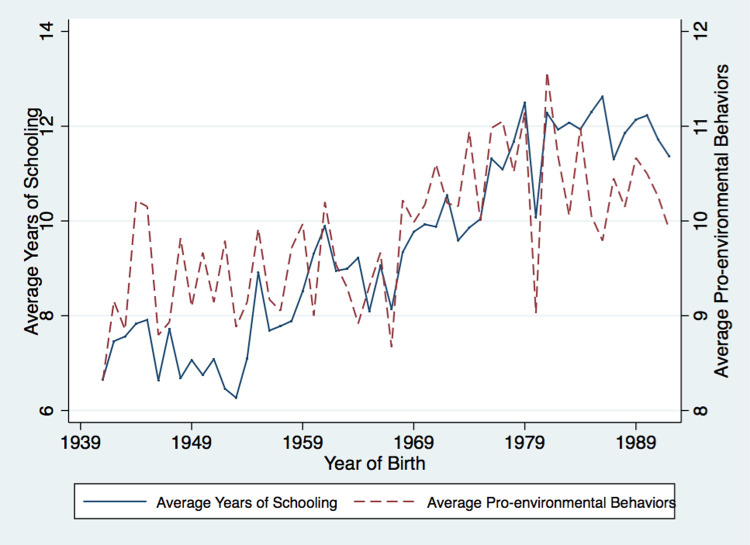
Fig 3. Average years of schooling and pro-environmental behaviors across year of birth.
Note: This figure illustrates the relationships between education and pro-environmental behaviors across year of birth. The solid line represents the average years of schooling and the dashed lines represent the average pro-environmental behaviors. Data source is CGSS 2010.

