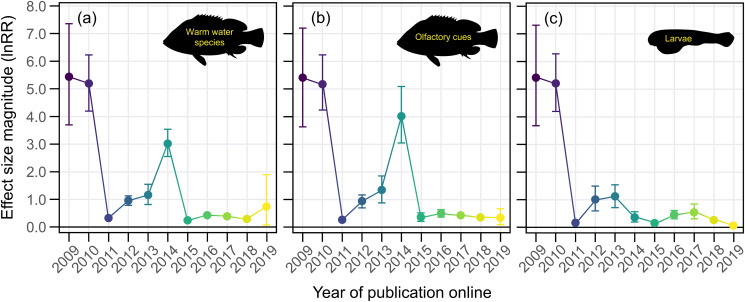
Fig 2. The decline effect cannot be explained by 3 commonly considered biological drivers of acidification effects.
Mean effect size magnitude (absolute lnRR ± upper and lower confidence bounds) as a function of time for datasets that only included experiments with (a) warm-water species, (b) olfactory-associated behaviors, and (c) larval life stages. Mean effect size magnitudes and confidence bounds were estimated using Bayesian simulations and a folded normal distribution. Note: Colors are aesthetic in nature and follow a gradient according to year of publication online. Source data for each figure panel can be found in S1 Data.

