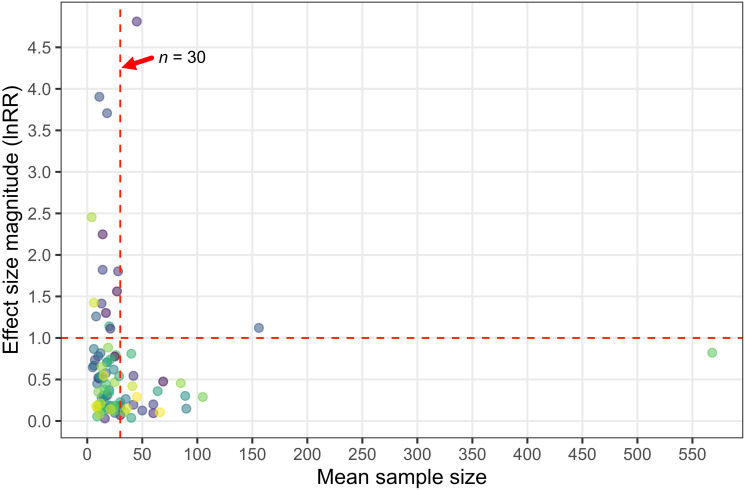
Fig 3. Studies with large effect sizes tend to have low samples sizes.
Mean effect size magnitude (absolute lnRR) for each study as a function of the mean sample size of that study (i.e., sample size per experimental treatment). Note that mean effect size for a given study is not a weighted effect size magnitude, but is simply computed as the mean of individual effect size magnitudes for a given study. The vertical red dashed line denotes a sample size of 30 fish, while the horizontal red dashed line represents a lnRR magnitude of 1. Source data for each figure panel can be found in S1 Data.

