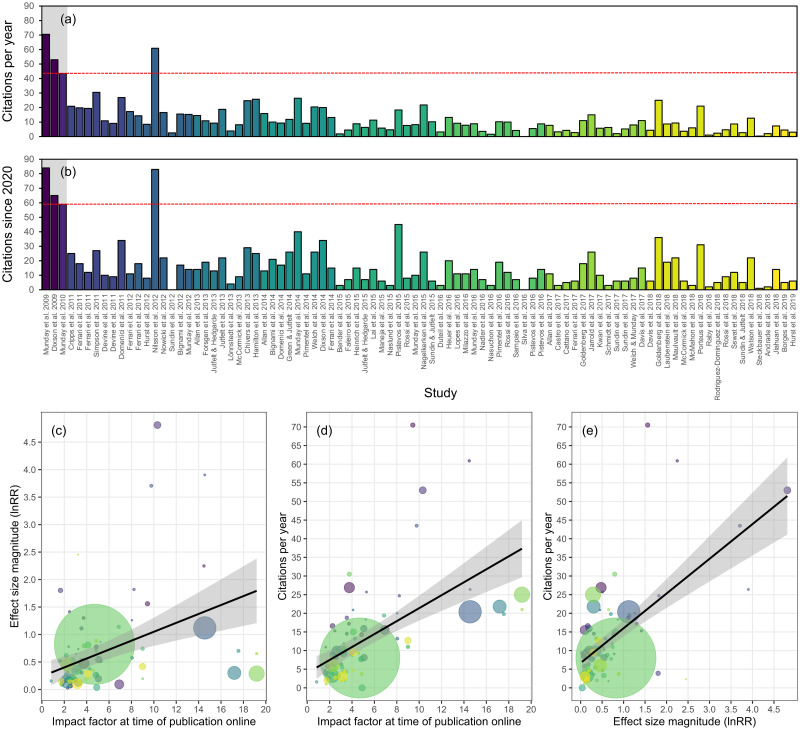
Fig 4. Strong effects are published in high-impact journals, and these studies are cited more than small effect studies in lower-impact journals.
(a, b) Google Scholar citation metrics as of September 10, 2021 for each of the studies included in our meta-analysis, including average citations per year (a) and total citations since 2020 (b). The initial 3 studies spearheading this field are denoted by the gray background, and the red dashed line represents the lowest citation metric among those 3 studies. Studies are ordered chronologically along the x-axis and color coded by year published online. (c) Mean effect size magnitude for each individual study as a function of journal impact factor (at time of online publication). (d) The number of citations per year for each study as a function of journal impact factor (at time of online publication). (e) The number of citations per year for each study as a function of mean effect size magnitude for that study. Note that, for panels (c) and (e), mean effect size magnitude for a given study is not a weighted effect size magnitude, but is simply computed as the mean of individual effect size magnitudes for a given study. Data are fit with linear curves and 95% confidence bounds, and points are color coded by study; the size of data points represents the relative mean sample size of the study. Source data for each figure panel can be found in S1 Data.

