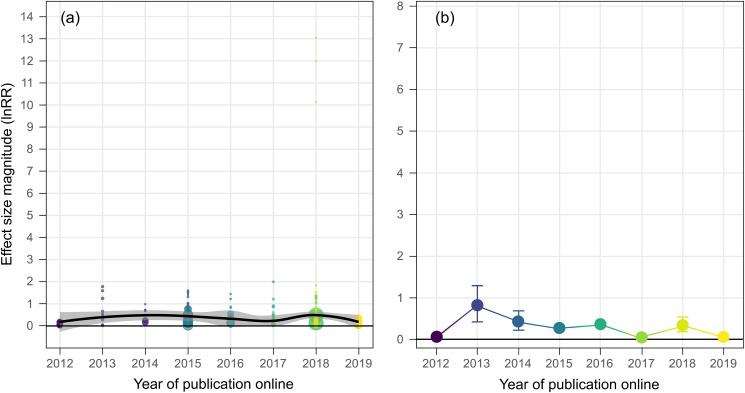
Fig 5. The decline effect in ocean acidification research on fish behavior excluding studies authored (or coauthored) by lead investigators of initial studies.
(a) Trend in raw effect size magnitudes (absolute lnRR) for each experiment in our dataset excluding all studies authored (or coauthored) by lead investigators of the 3 initial studies [8–10] plotted as a function of year of publication online and color coded according to study. Data are fit with a Loess curve with 95% confidence bounds. (b) Mean effect size magnitude (absolute lnRR ± upper and lower confidence bounds) for each year of publication online in our dataset excluding all studies authored (or coauthored) by lead investigators of the 3 initial studies. Mean effect size magnitudes and confidence bounds were estimated using Bayesian simulations and a folded normal distribution. Note: Colors in (b) are aesthetic in nature and follow a gradient according to year of publication. Also note that data begin in 2012 since all publications prior to 2012 included initial lead investigators in the author list. Vertical axes are scaled to enable direct comparison with Fig 1. Source data for each figure panel can be found in S1 Data.

