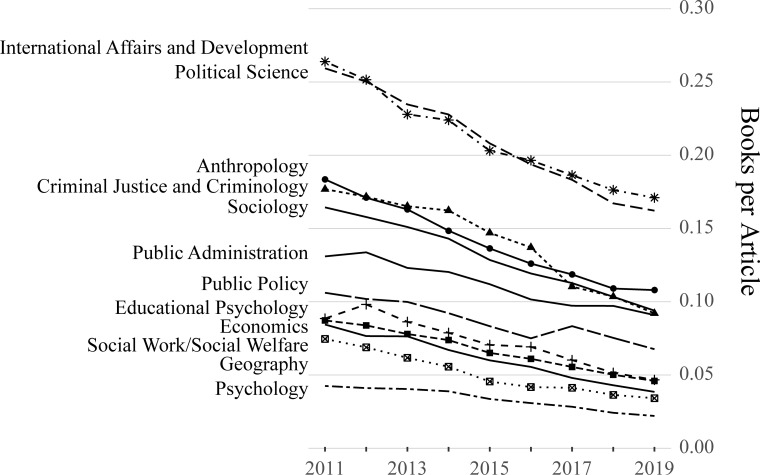
Fig 1. Books per journal article between 2011 and 2019.
Both books and journal articles represent five-year sums, such that the 2011 data point represents the total books published between 2007 and 2011 divided by the total articles published between 2007 and 2011, the 2012 data point represents the total books published between 2008 and 2012 divided by the total articles published between 2008 and 2012, and so on.

