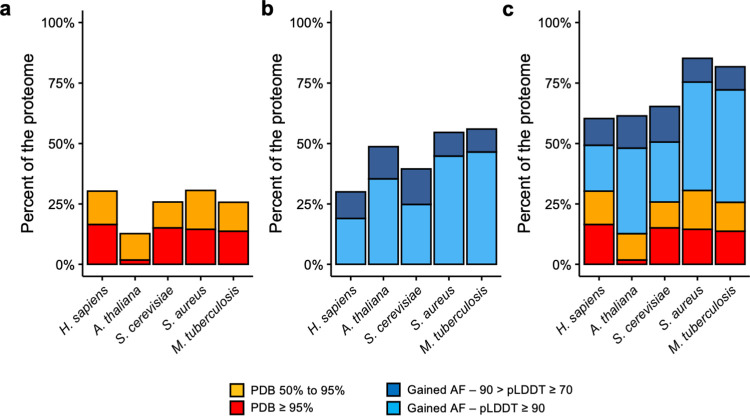
Fig 4. Changes in protein structural coverage in other organisms.
a) Comparison of the structural coverage (y-axis) of the five different organisms (x-axis) based on PDB sequence identity. b) Additional structural coverage provided by AlphaFold models in the different species, split by pLDDT score. c) Current high quality structural coverage of the five organisms combining PDB and AlphaFold data.

